

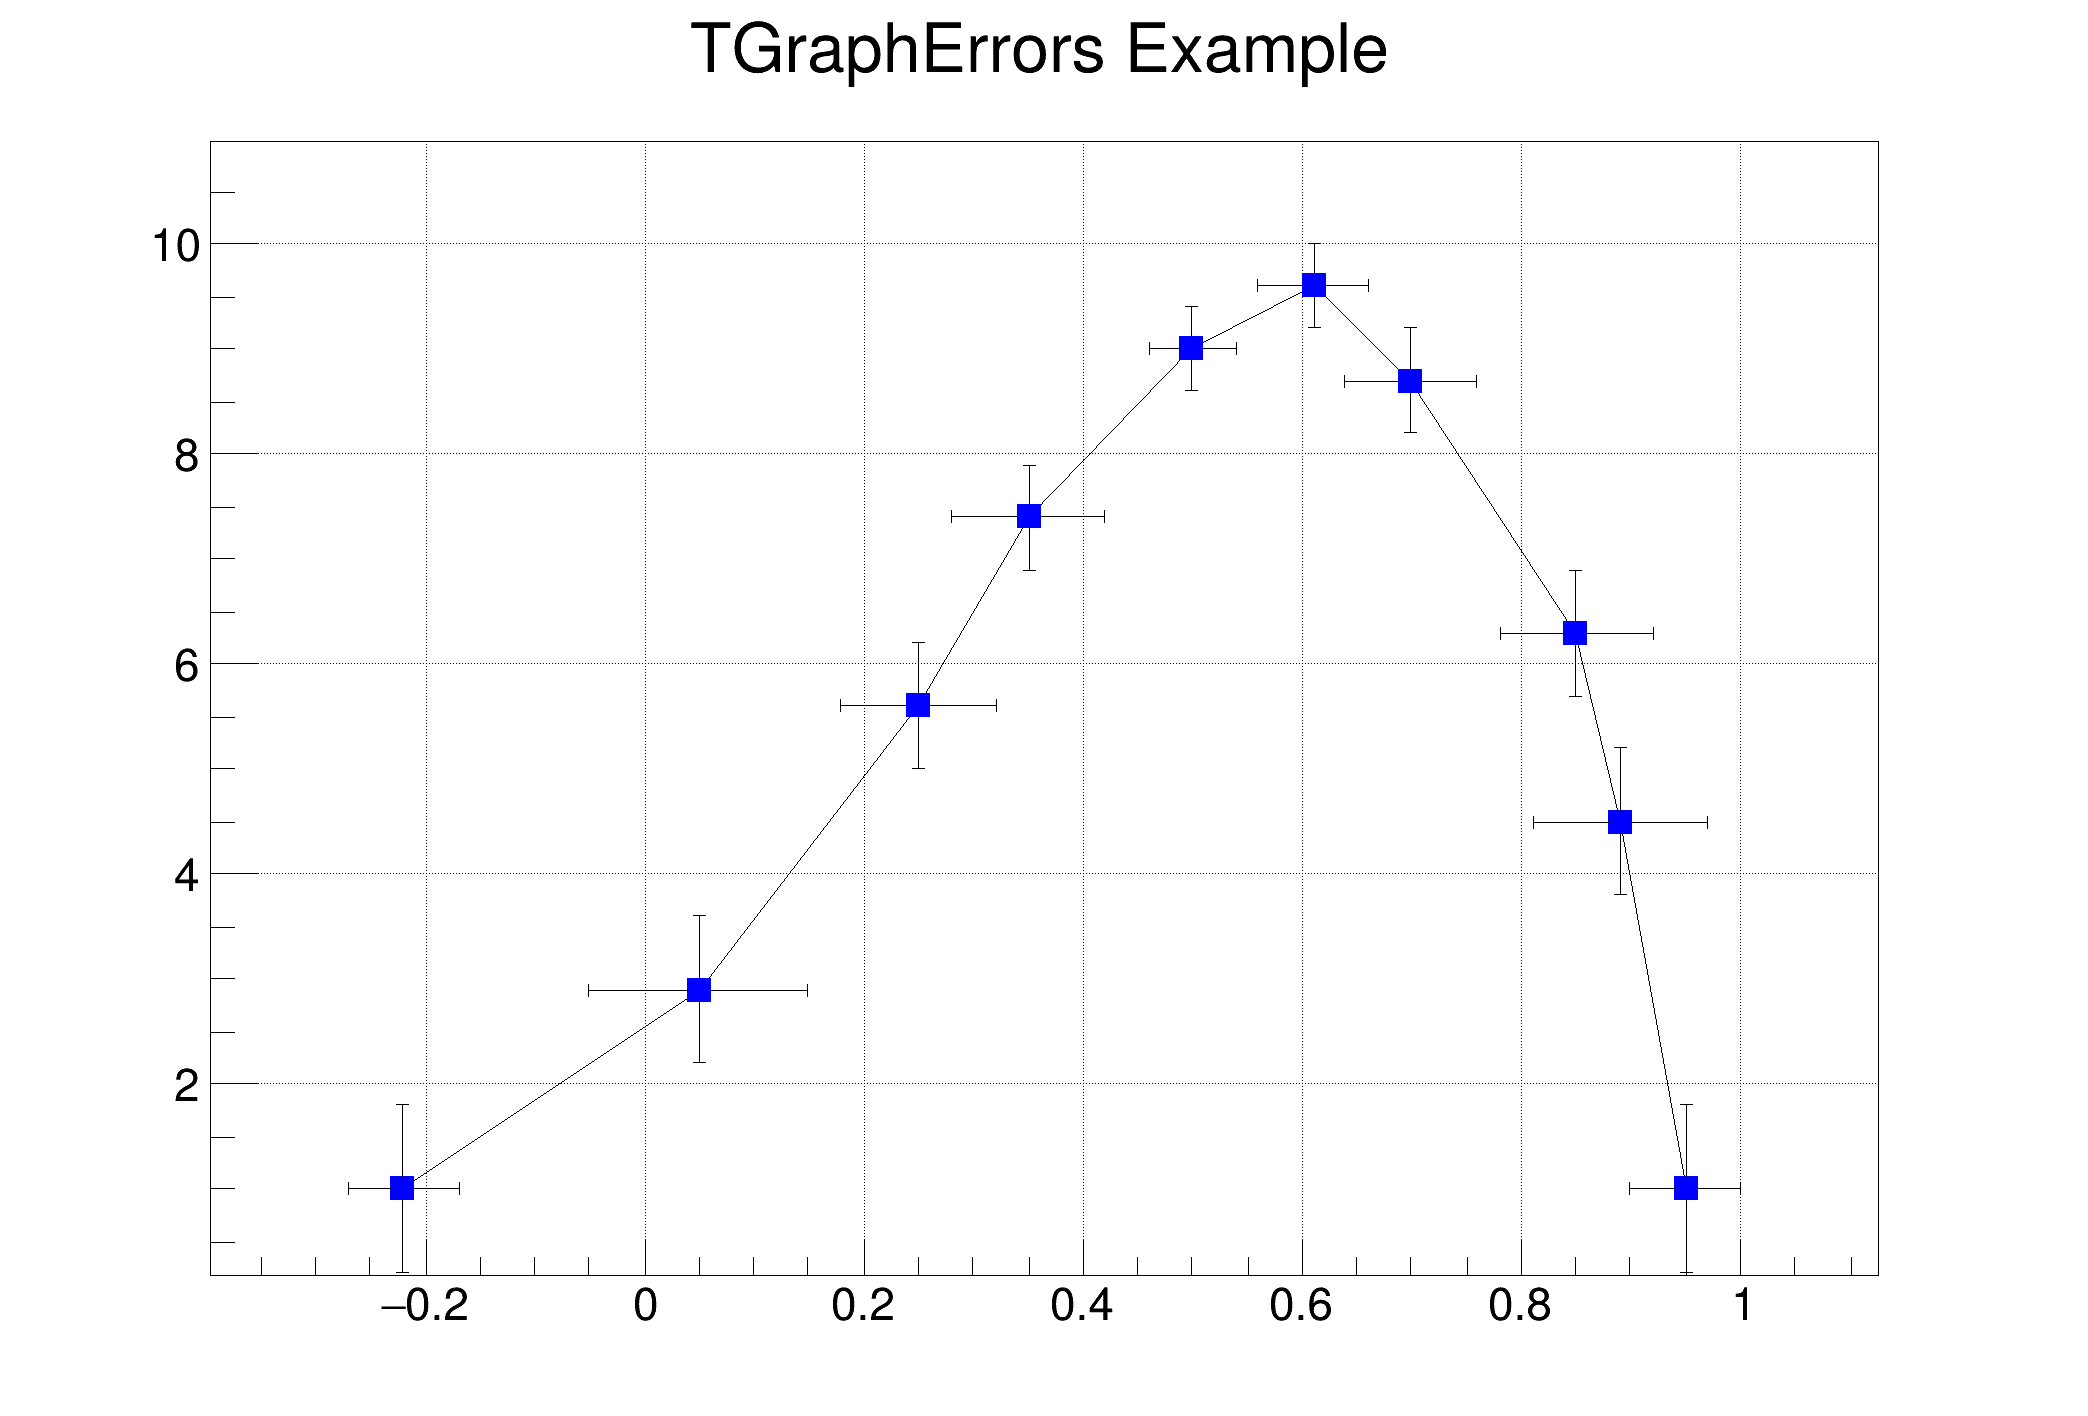
 Create and draw a graph with error bars.
If more graphs are needed, see the gr03_err2gr.C tutorial
See the TGraphErrors documentation
import numpy as np
import ROOT
c1 =
ROOT.TCanvas(
"c1",
"A Simple Graph with error bars", 200, 10, 700, 500)
n = 10
x =
np.array([-0.22, 0.05, 0.25, 0.35, 0.5, 0.61, 0.7, 0.85, 0.89, 0.95])
y =
np.array([1, 2.9, 5.6, 7.4, 9, 9.6, 8.7, 6.3, 4.5, 1])
ex =
np.array([0.05, 0.1, 0.07, 0.07, 0.04, 0.05, 0.06, 0.07, 0.08, 0.05])
ey =
np.array([0.8, 0.7, 0.6, 0.5, 0.4, 0.4, 0.5, 0.6, 0.7, 0.8])
ROOT::Detail::TRangeCast< T, true > TRangeDynCast
TRangeDynCast is an adapter class that allows the typed iteration through a TCollection.
- Author
- Rene Brun, Jamie Gooding
Definition in file gr002_errors.py.