 |
ROOT
Reference Guide |

|
| |
ROOT
Reference Guide |
|
Files | |
| gr001_simple.C | |
 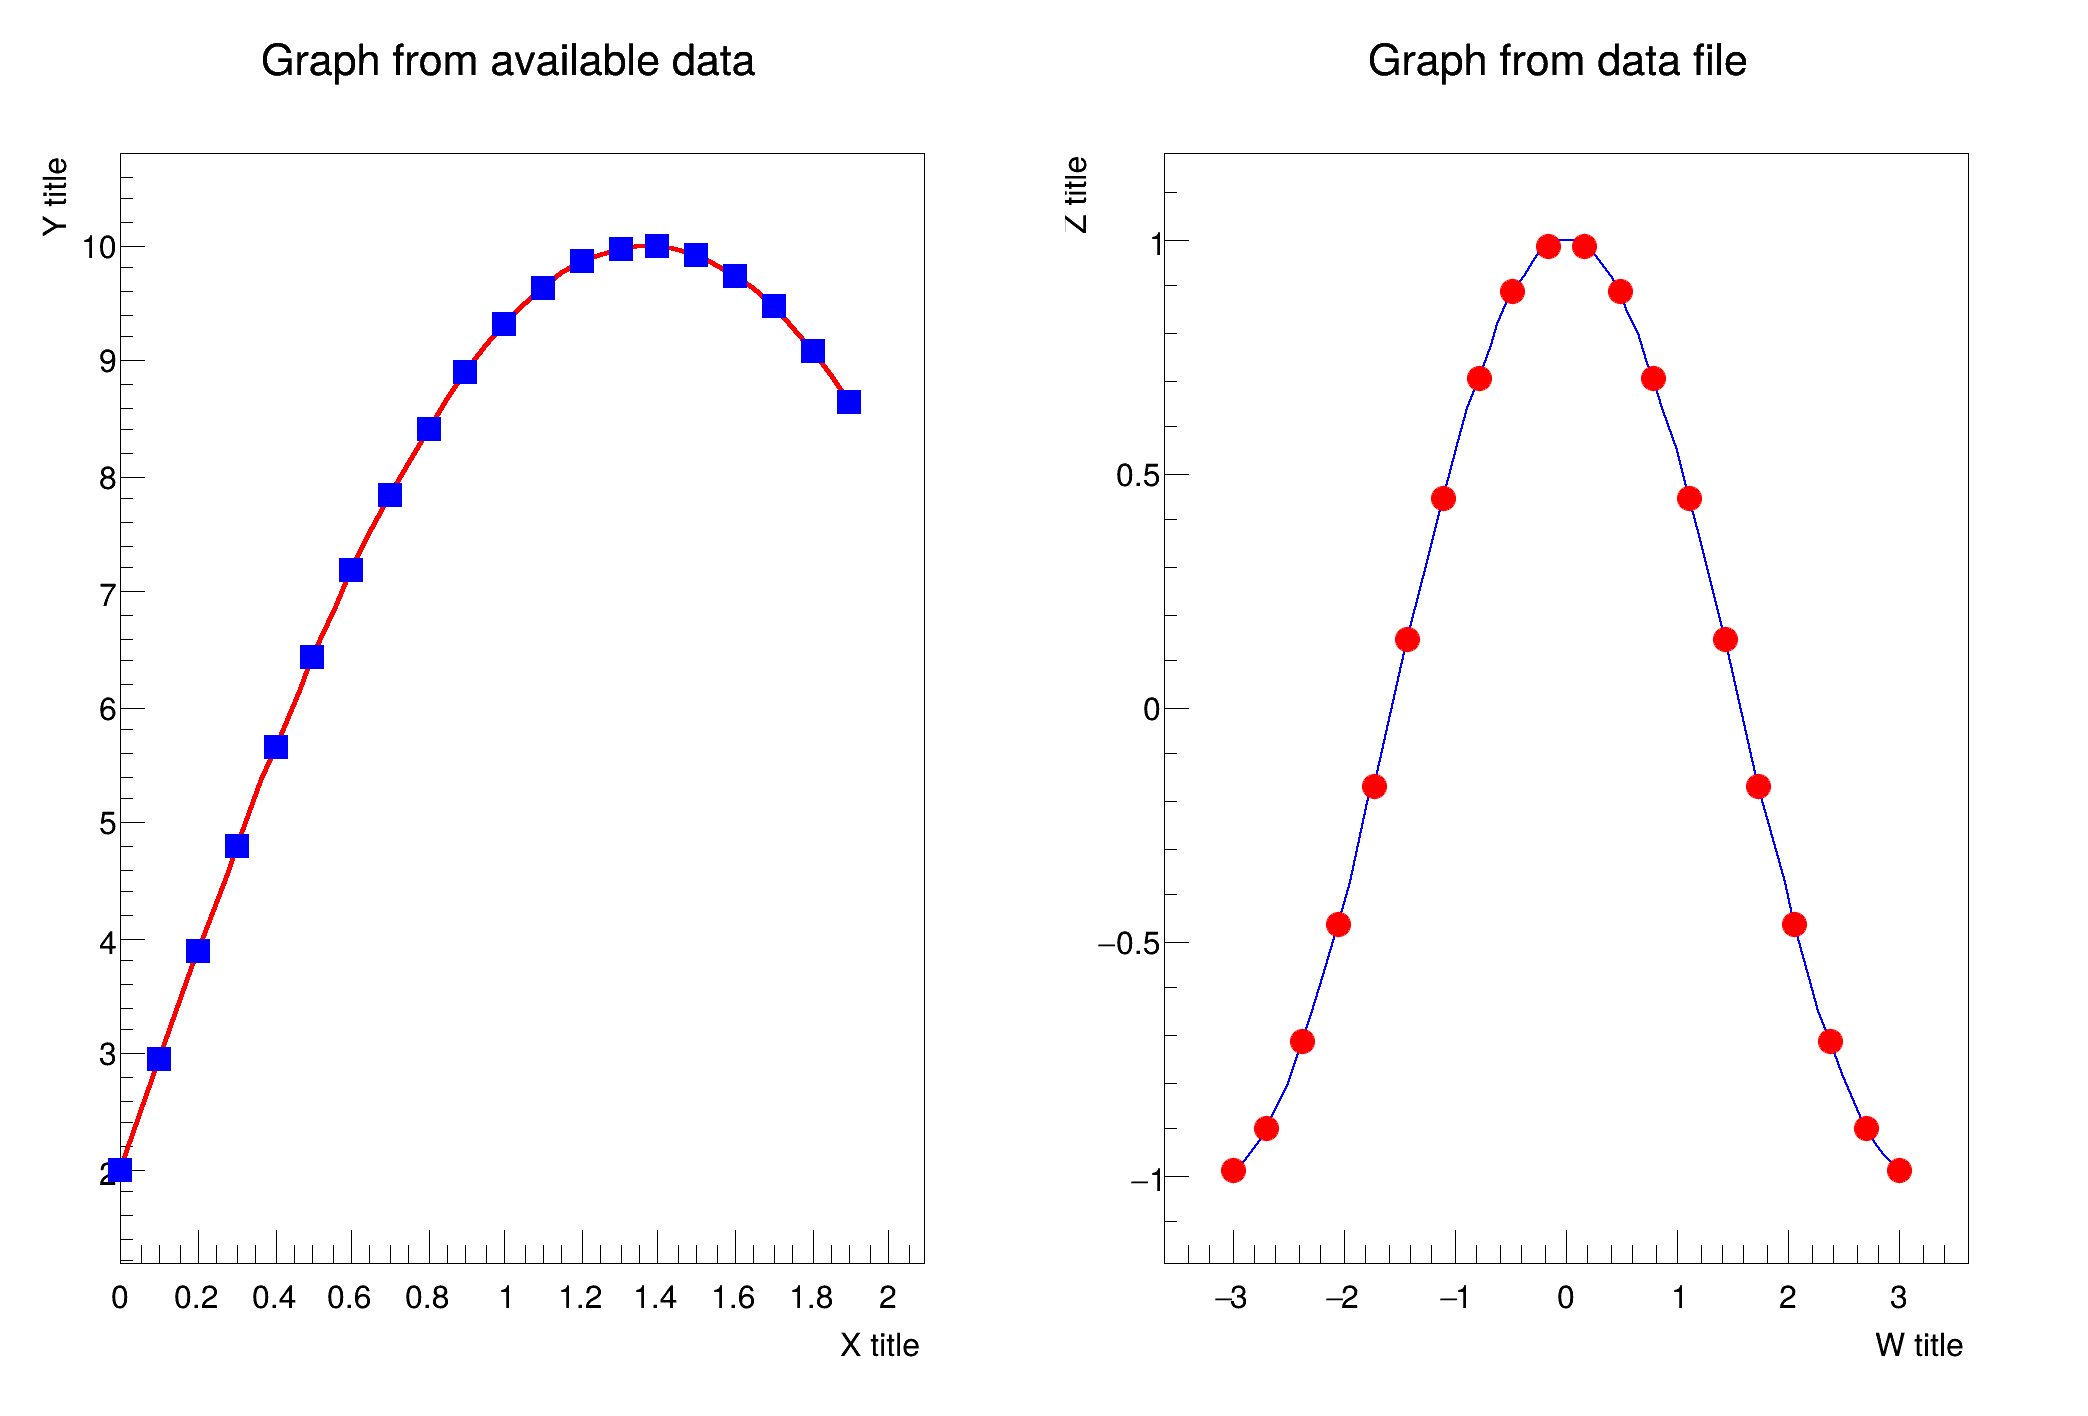 This tutorial demonstrates how to create simple graphs in ROOT. This tutorial demonstrates how to create simple graphs in ROOT. | |
| gr001_simple.py | |
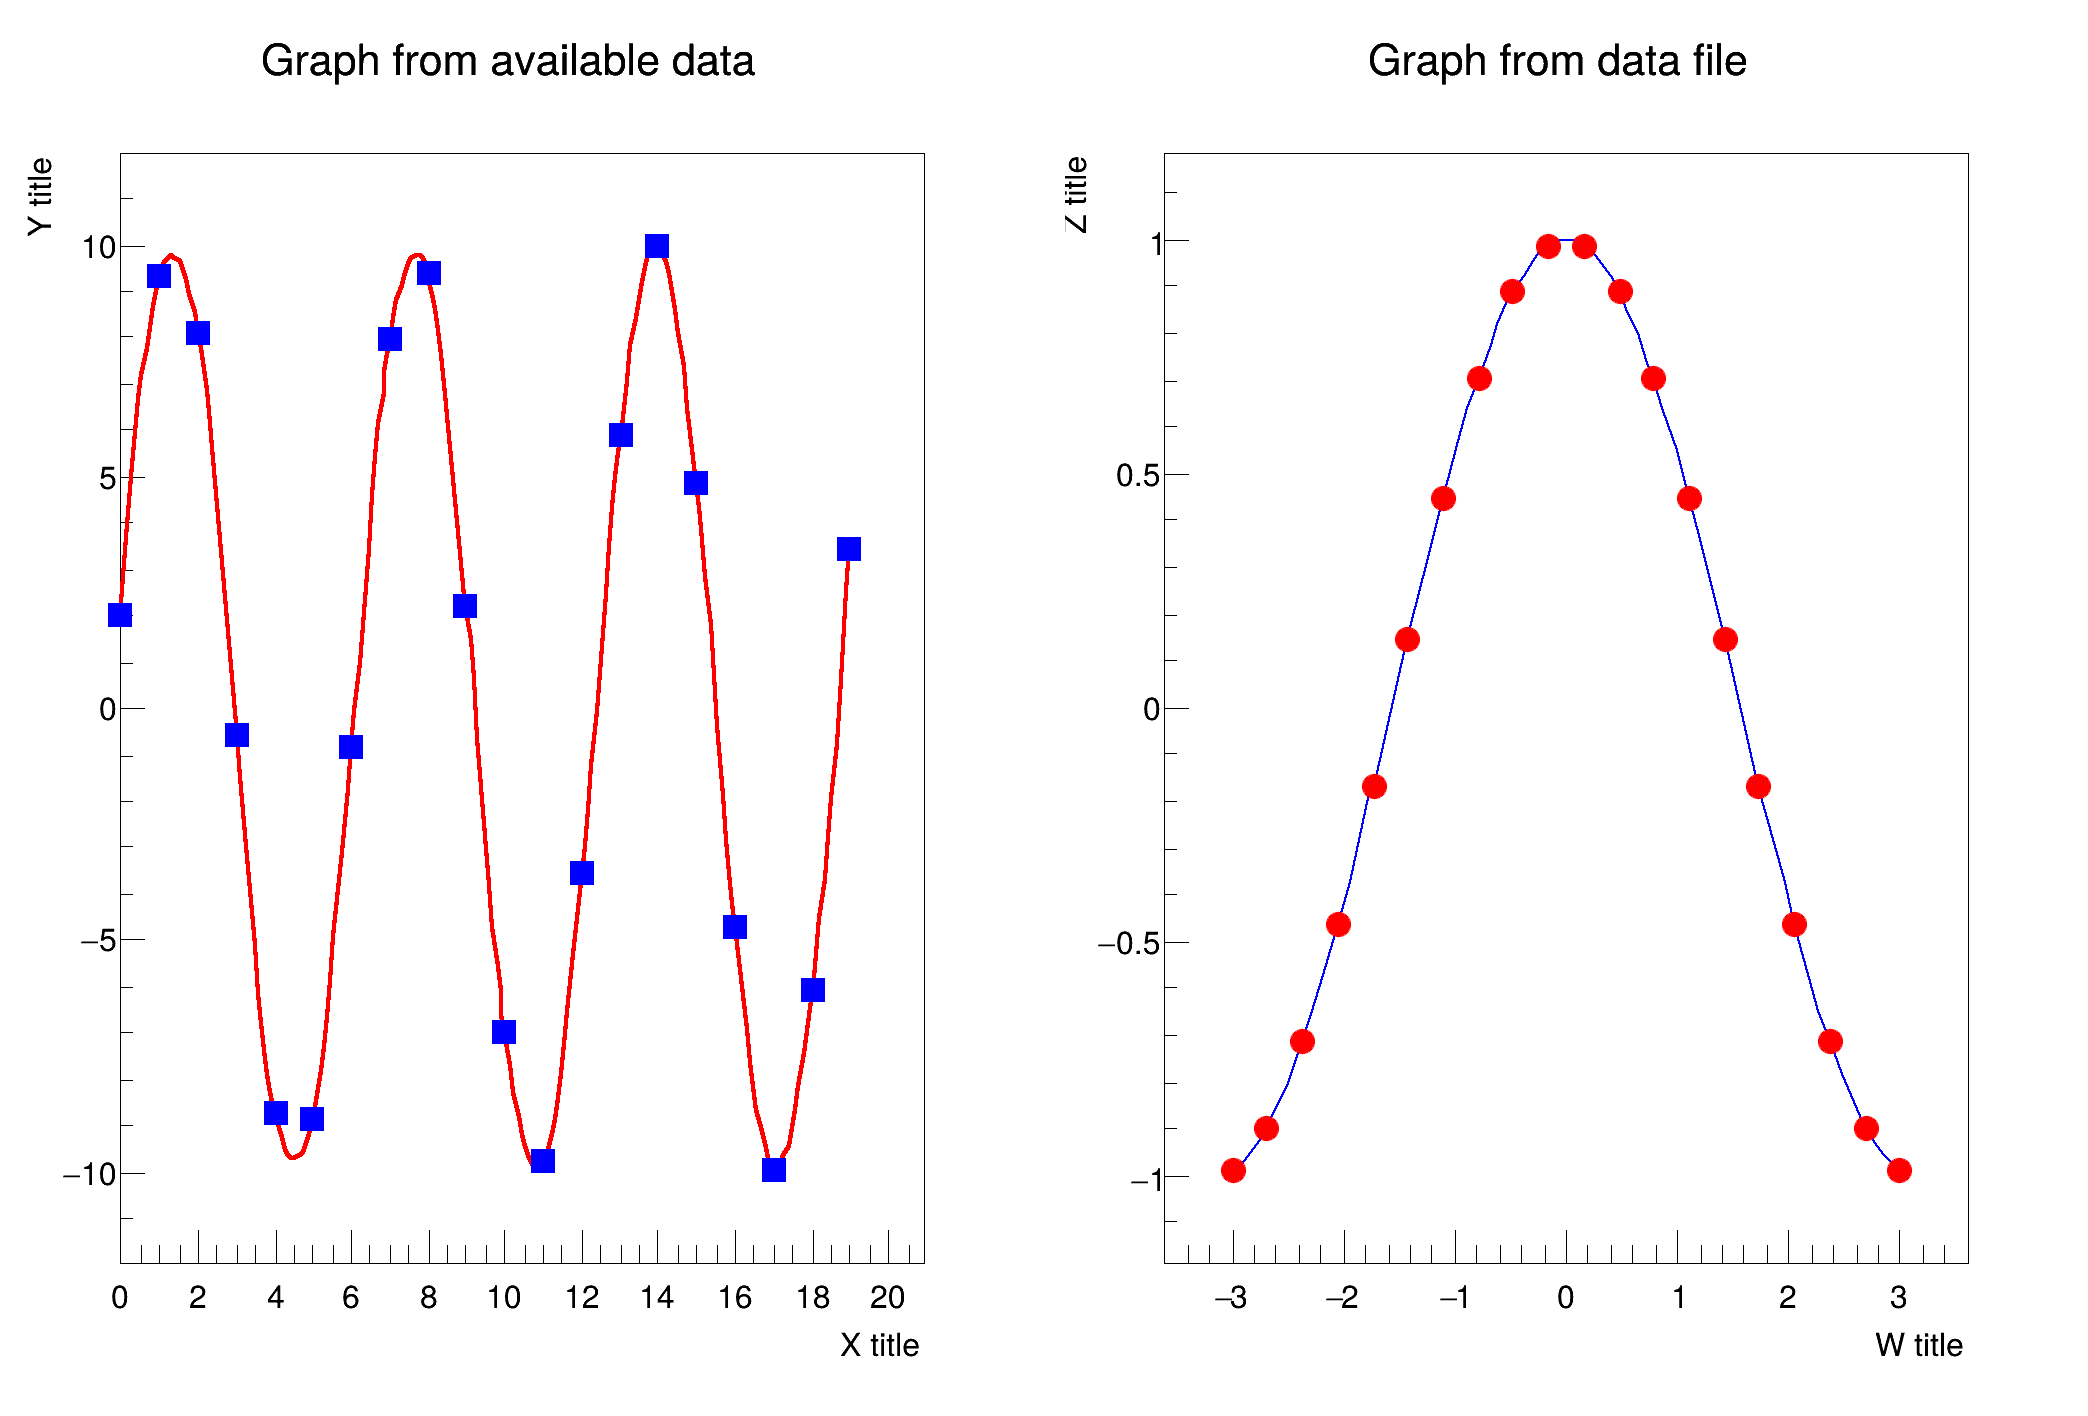 This tutorial demonstrates how to create simple graphs in ROOT. This tutorial demonstrates how to create simple graphs in ROOT. | |
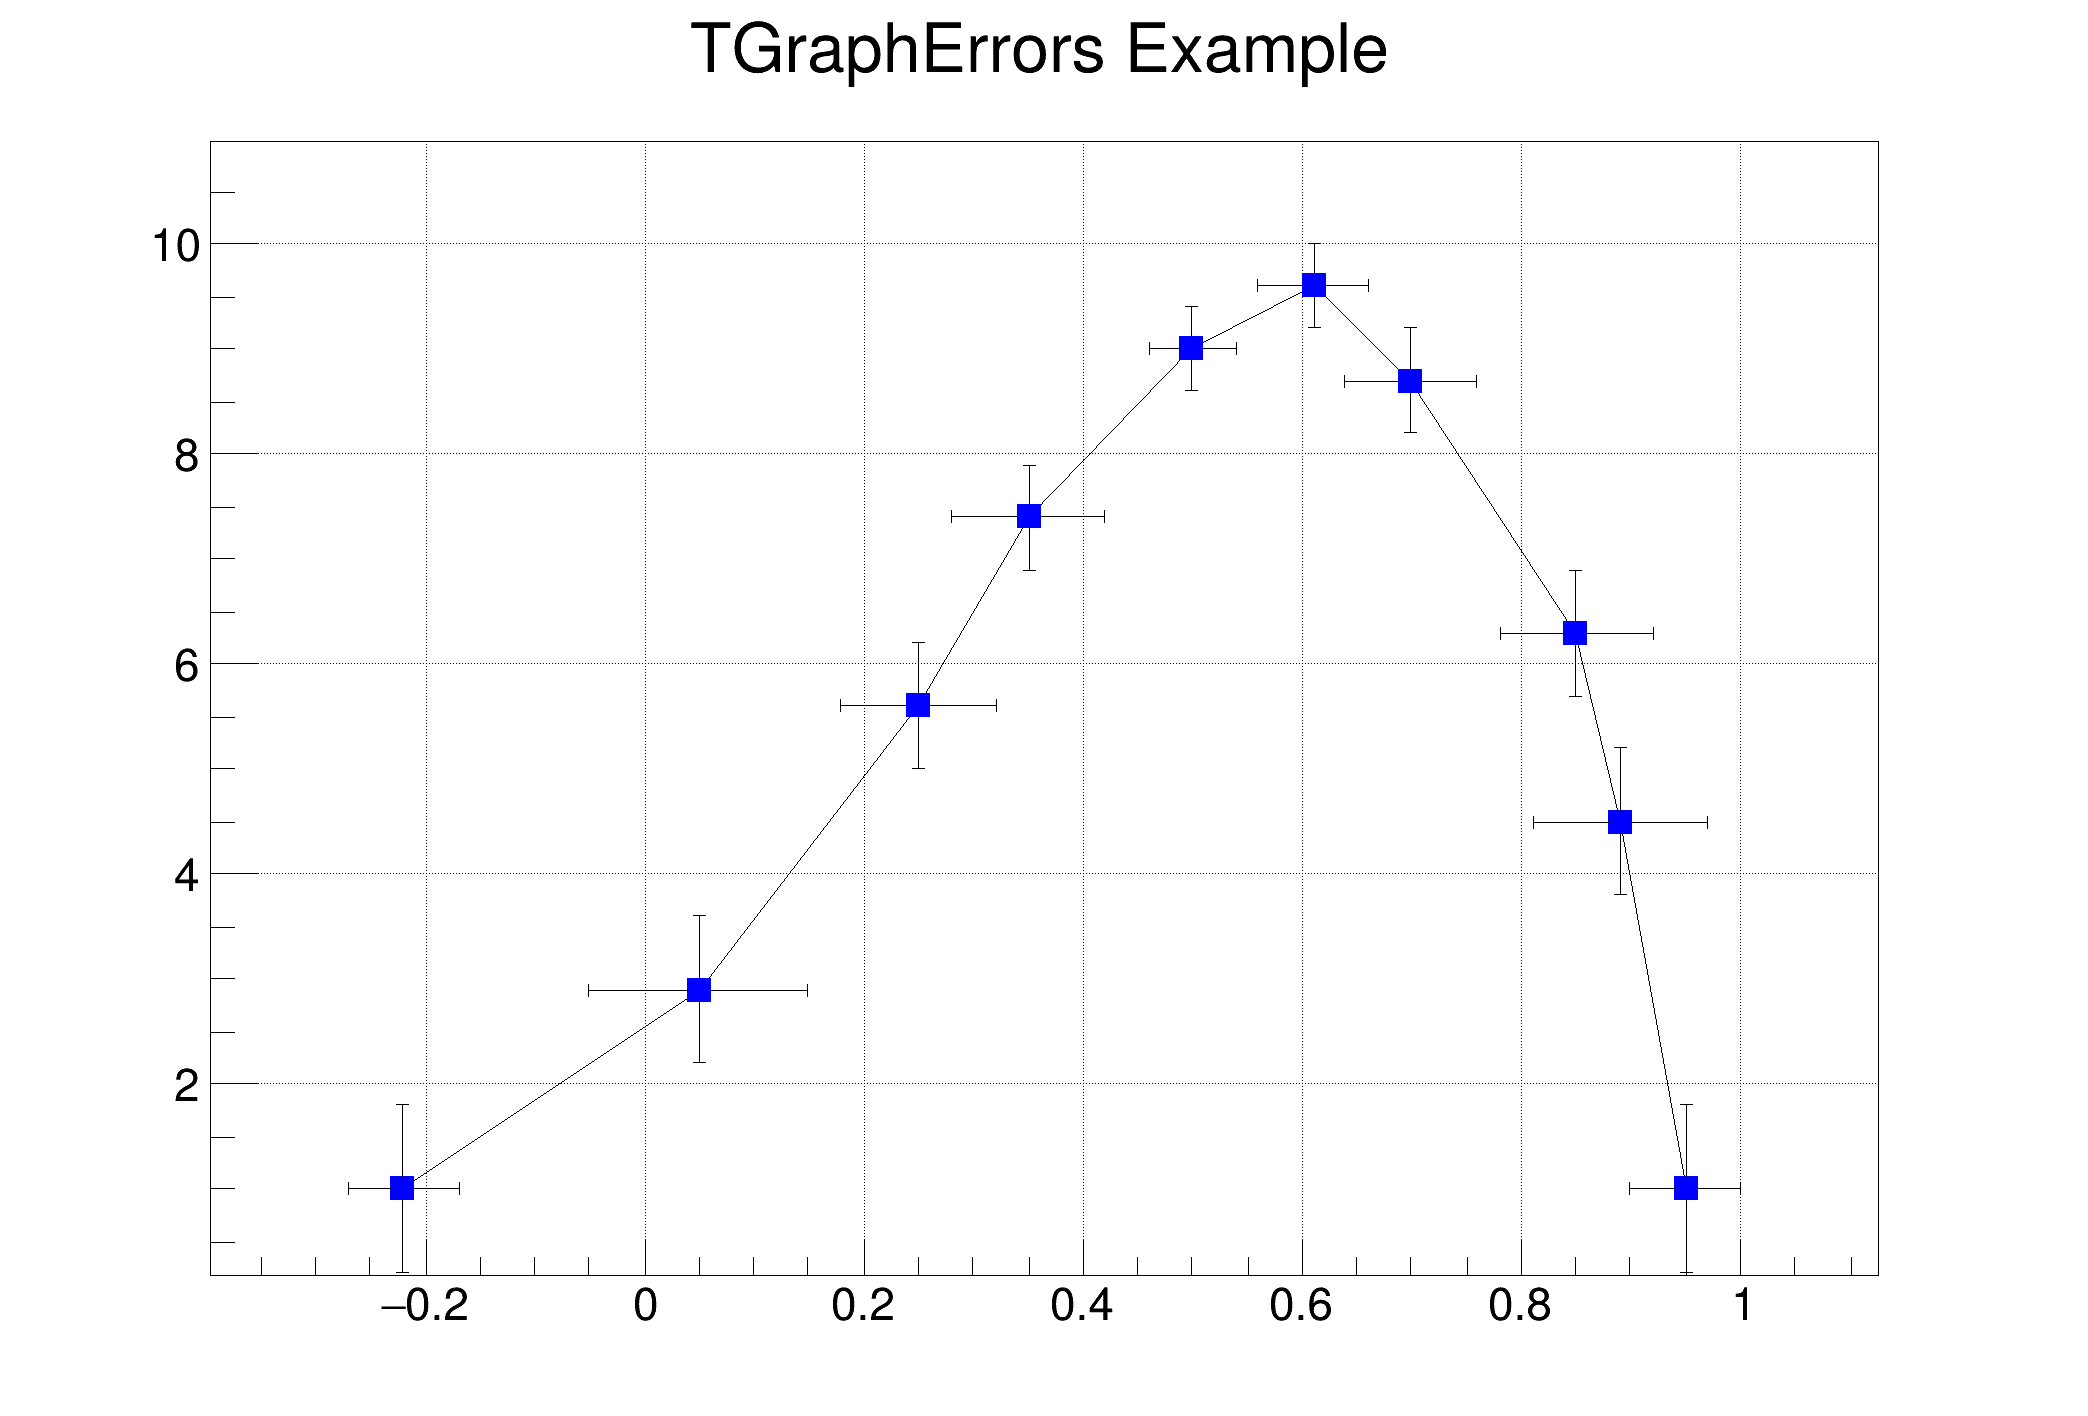
| gr002_errors.C | |
 Create and draw a graph with error bars. Create and draw a graph with error bars. | |
| gr002_errors.py | |
 Create and draw a graph with error bars. Create and draw a graph with error bars. | |
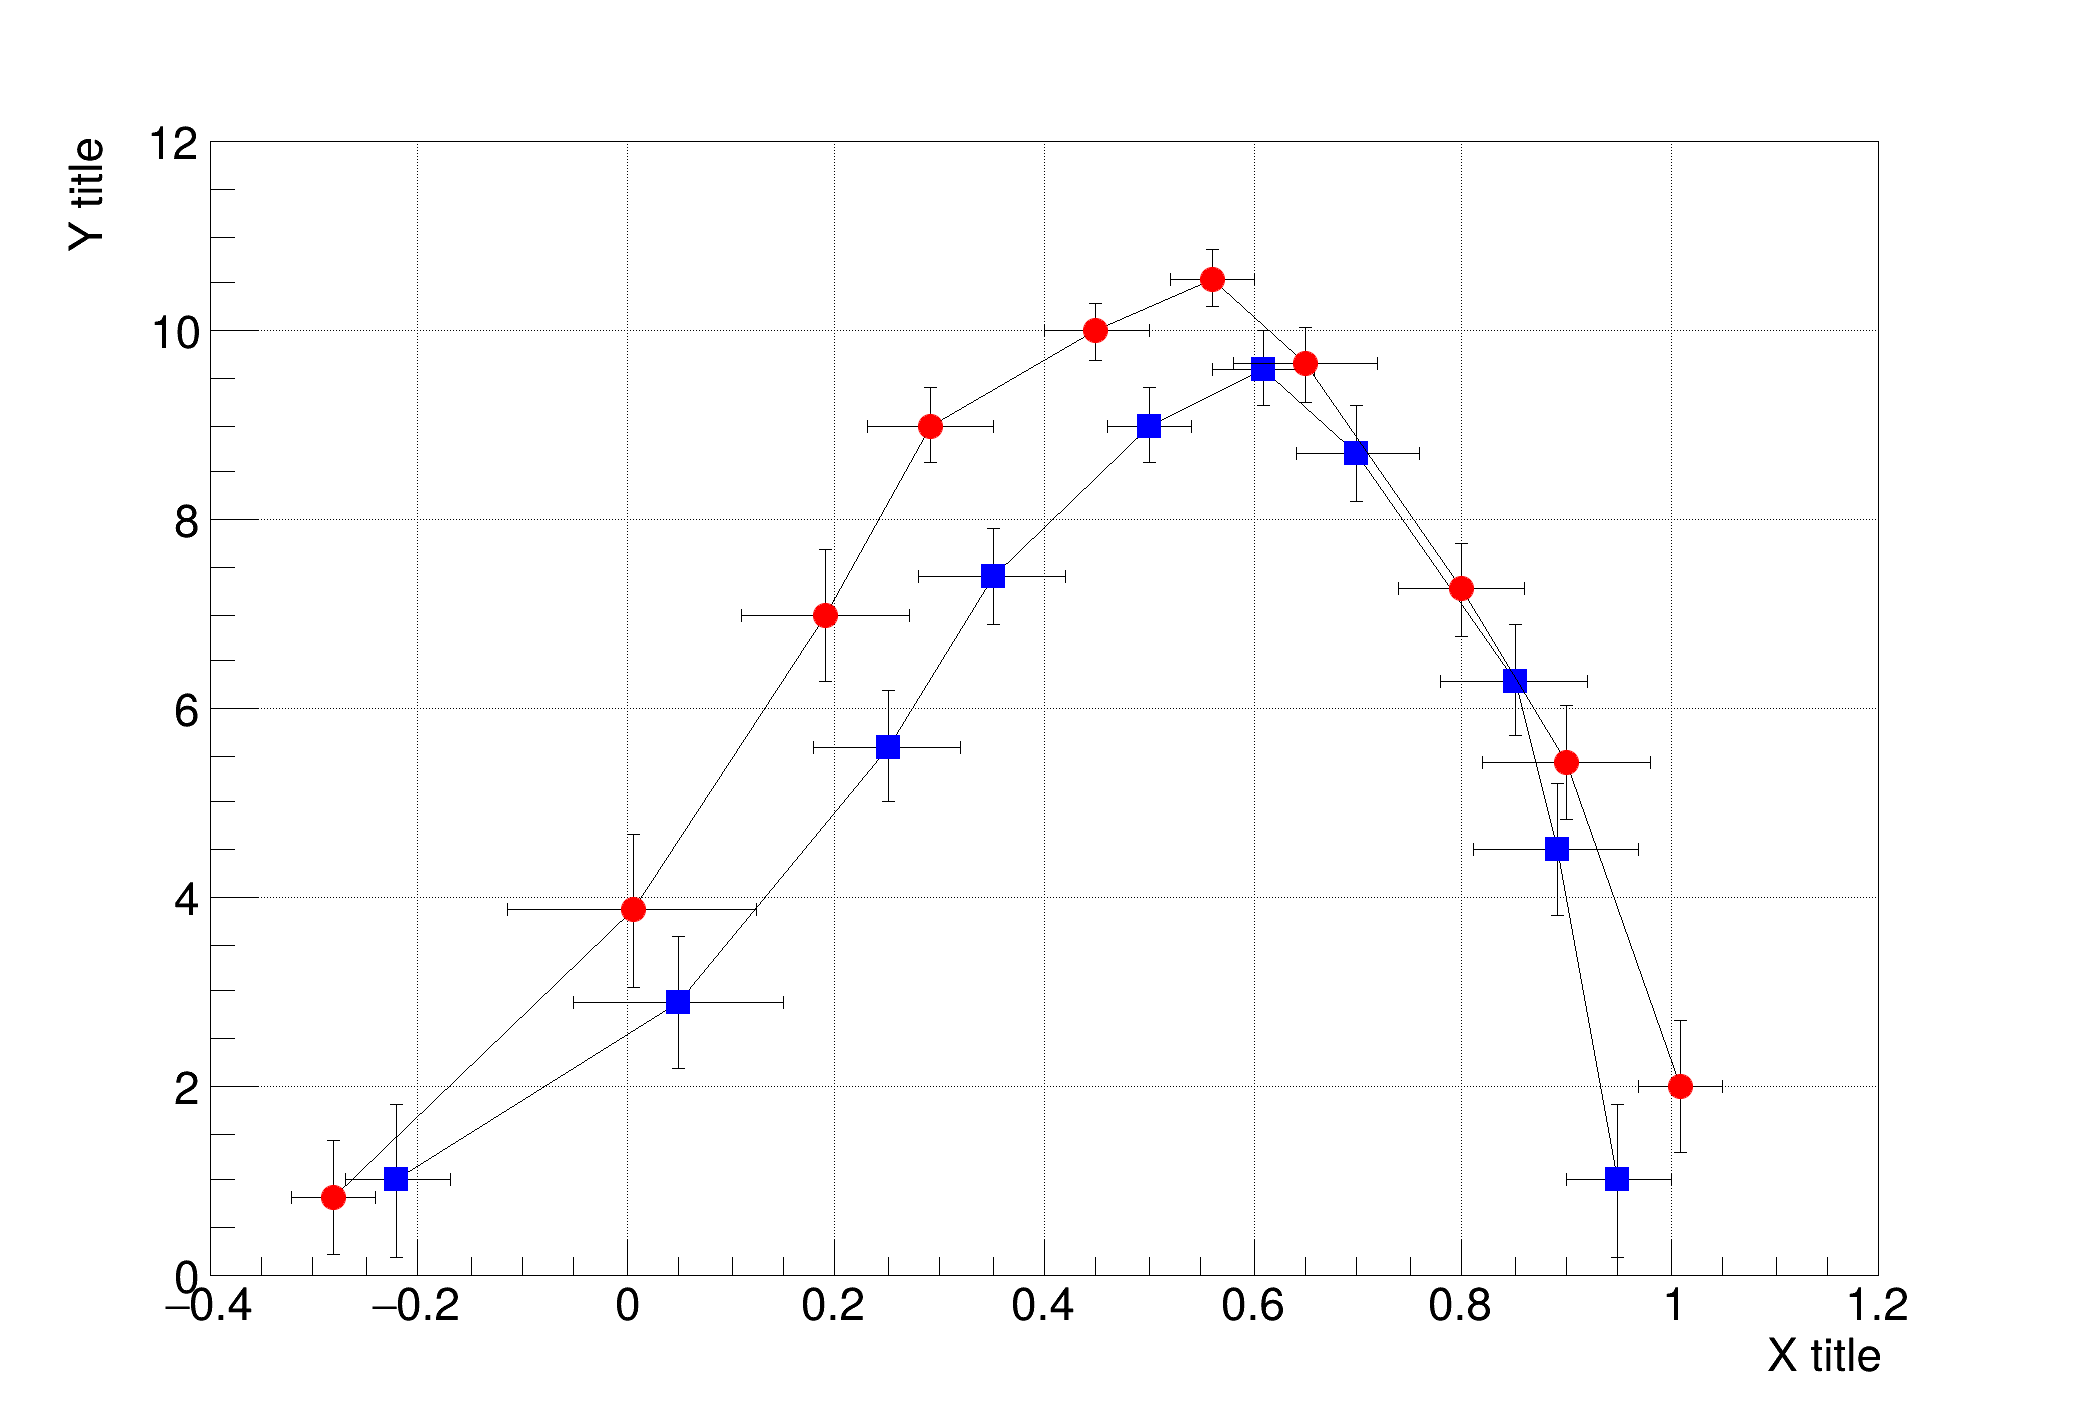
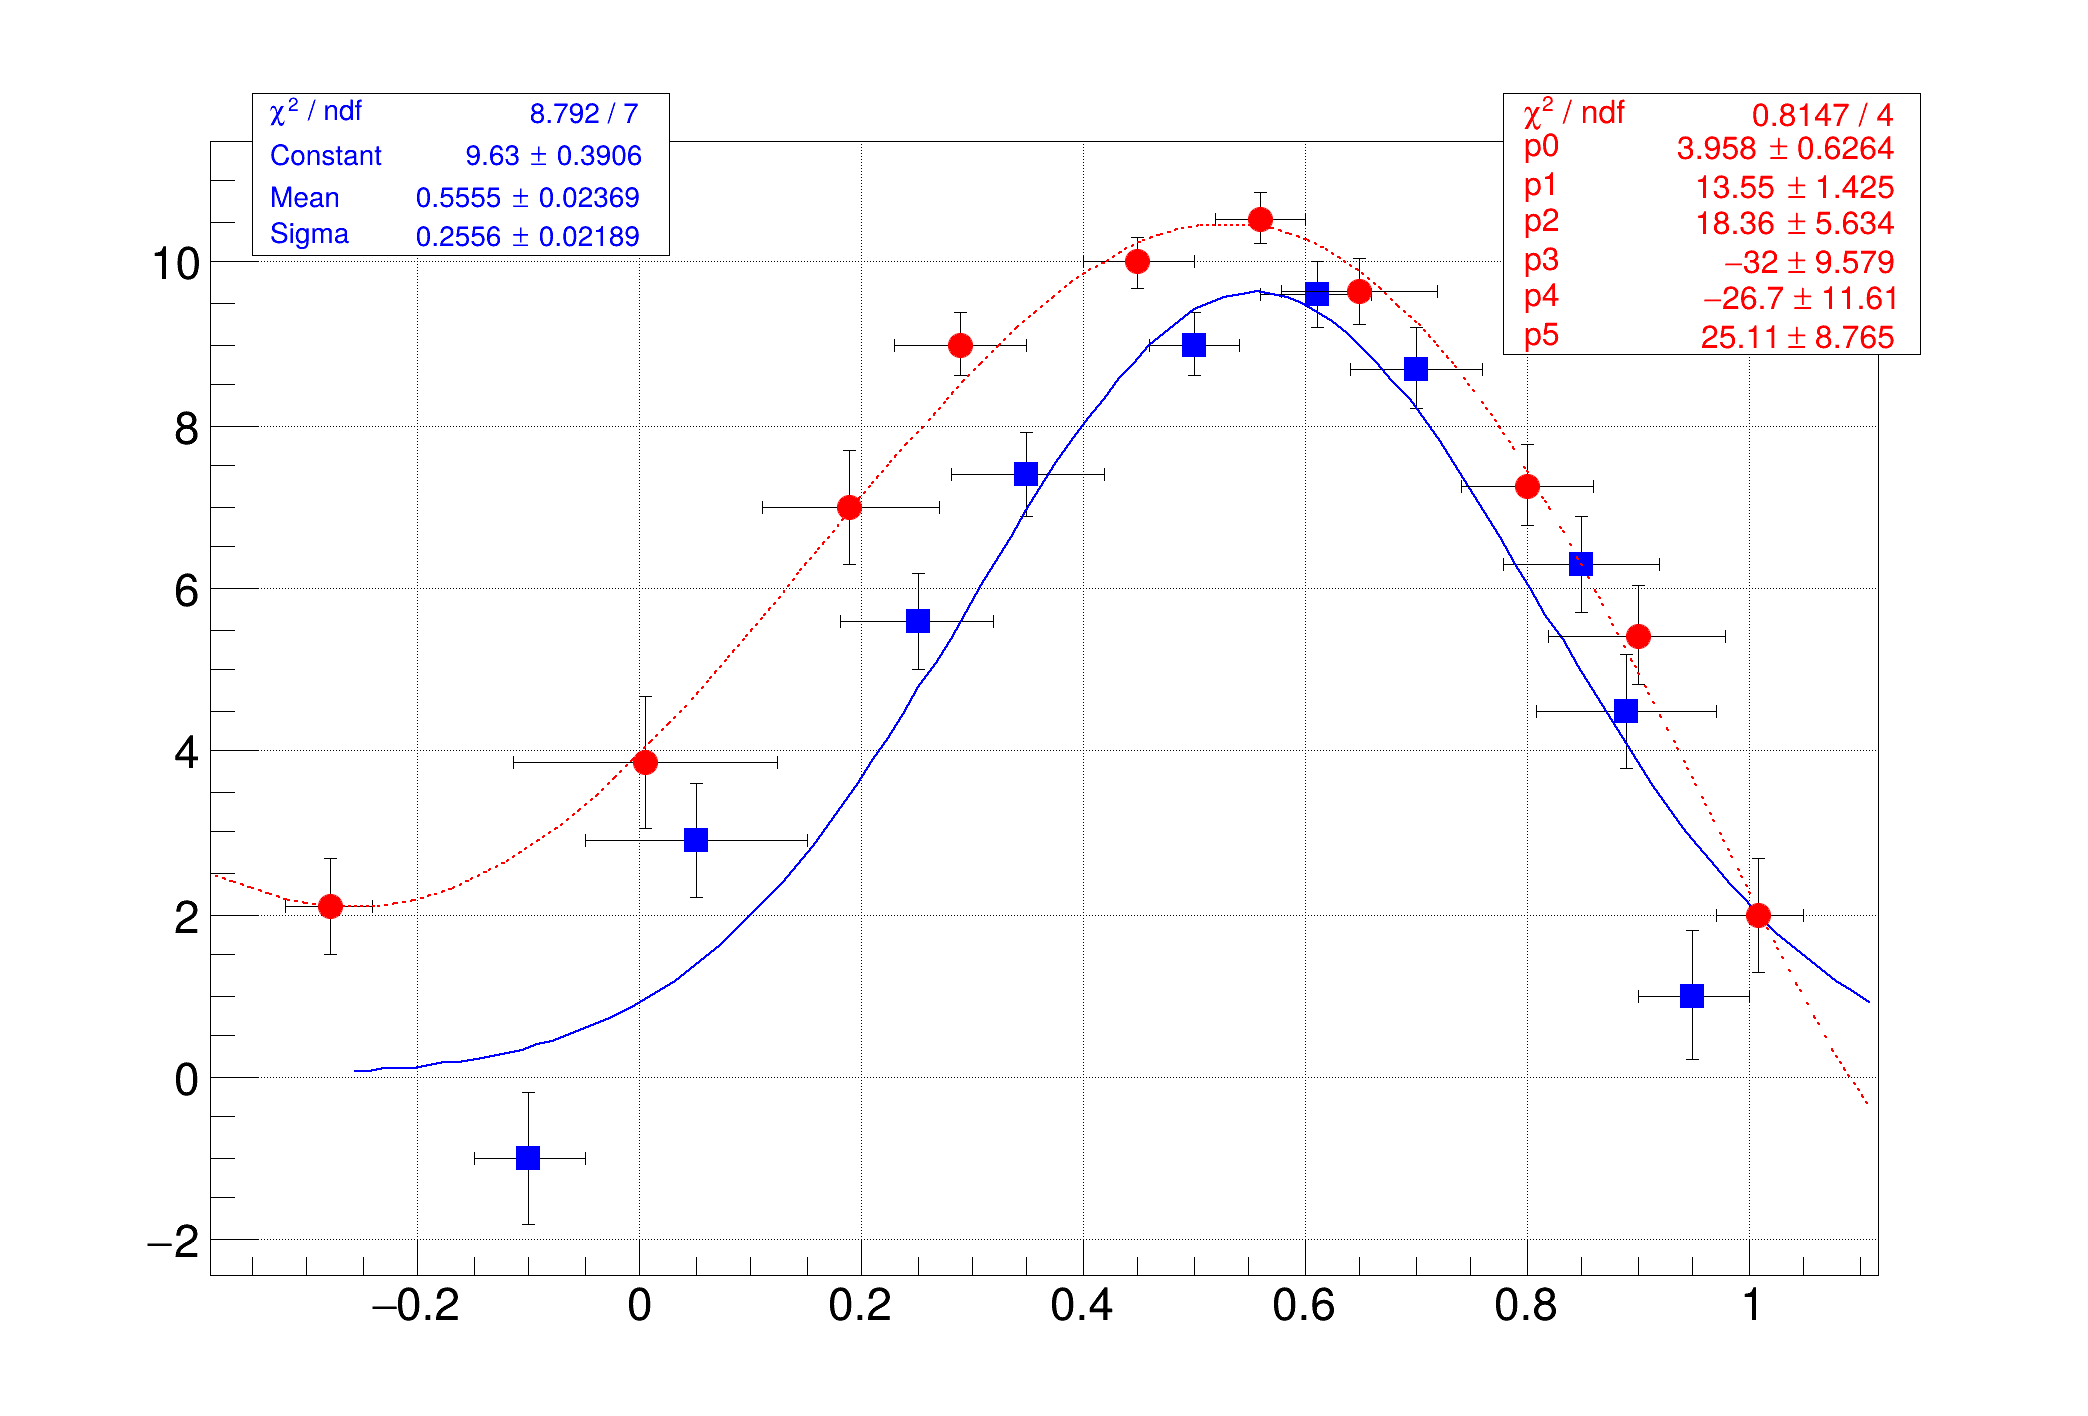
| gr003_errors2.C | |
 Create and draw two graphs with error bars, superposed on the same canvas Create and draw two graphs with error bars, superposed on the same canvas | |
| gr003_errors2.py | |
 Create and draw two graphs with error bars, superposed on the same canvas Create and draw two graphs with error bars, superposed on the same canvas | |
| gr004_errors_asym.C | |
 This tutorial demonstrates the use of TGraphAsymmErrors to plot a graph with asymmetrical errors on both the x and y axes. This tutorial demonstrates the use of TGraphAsymmErrors to plot a graph with asymmetrical errors on both the x and y axes. | |
| gr004_errors_asym.py | |
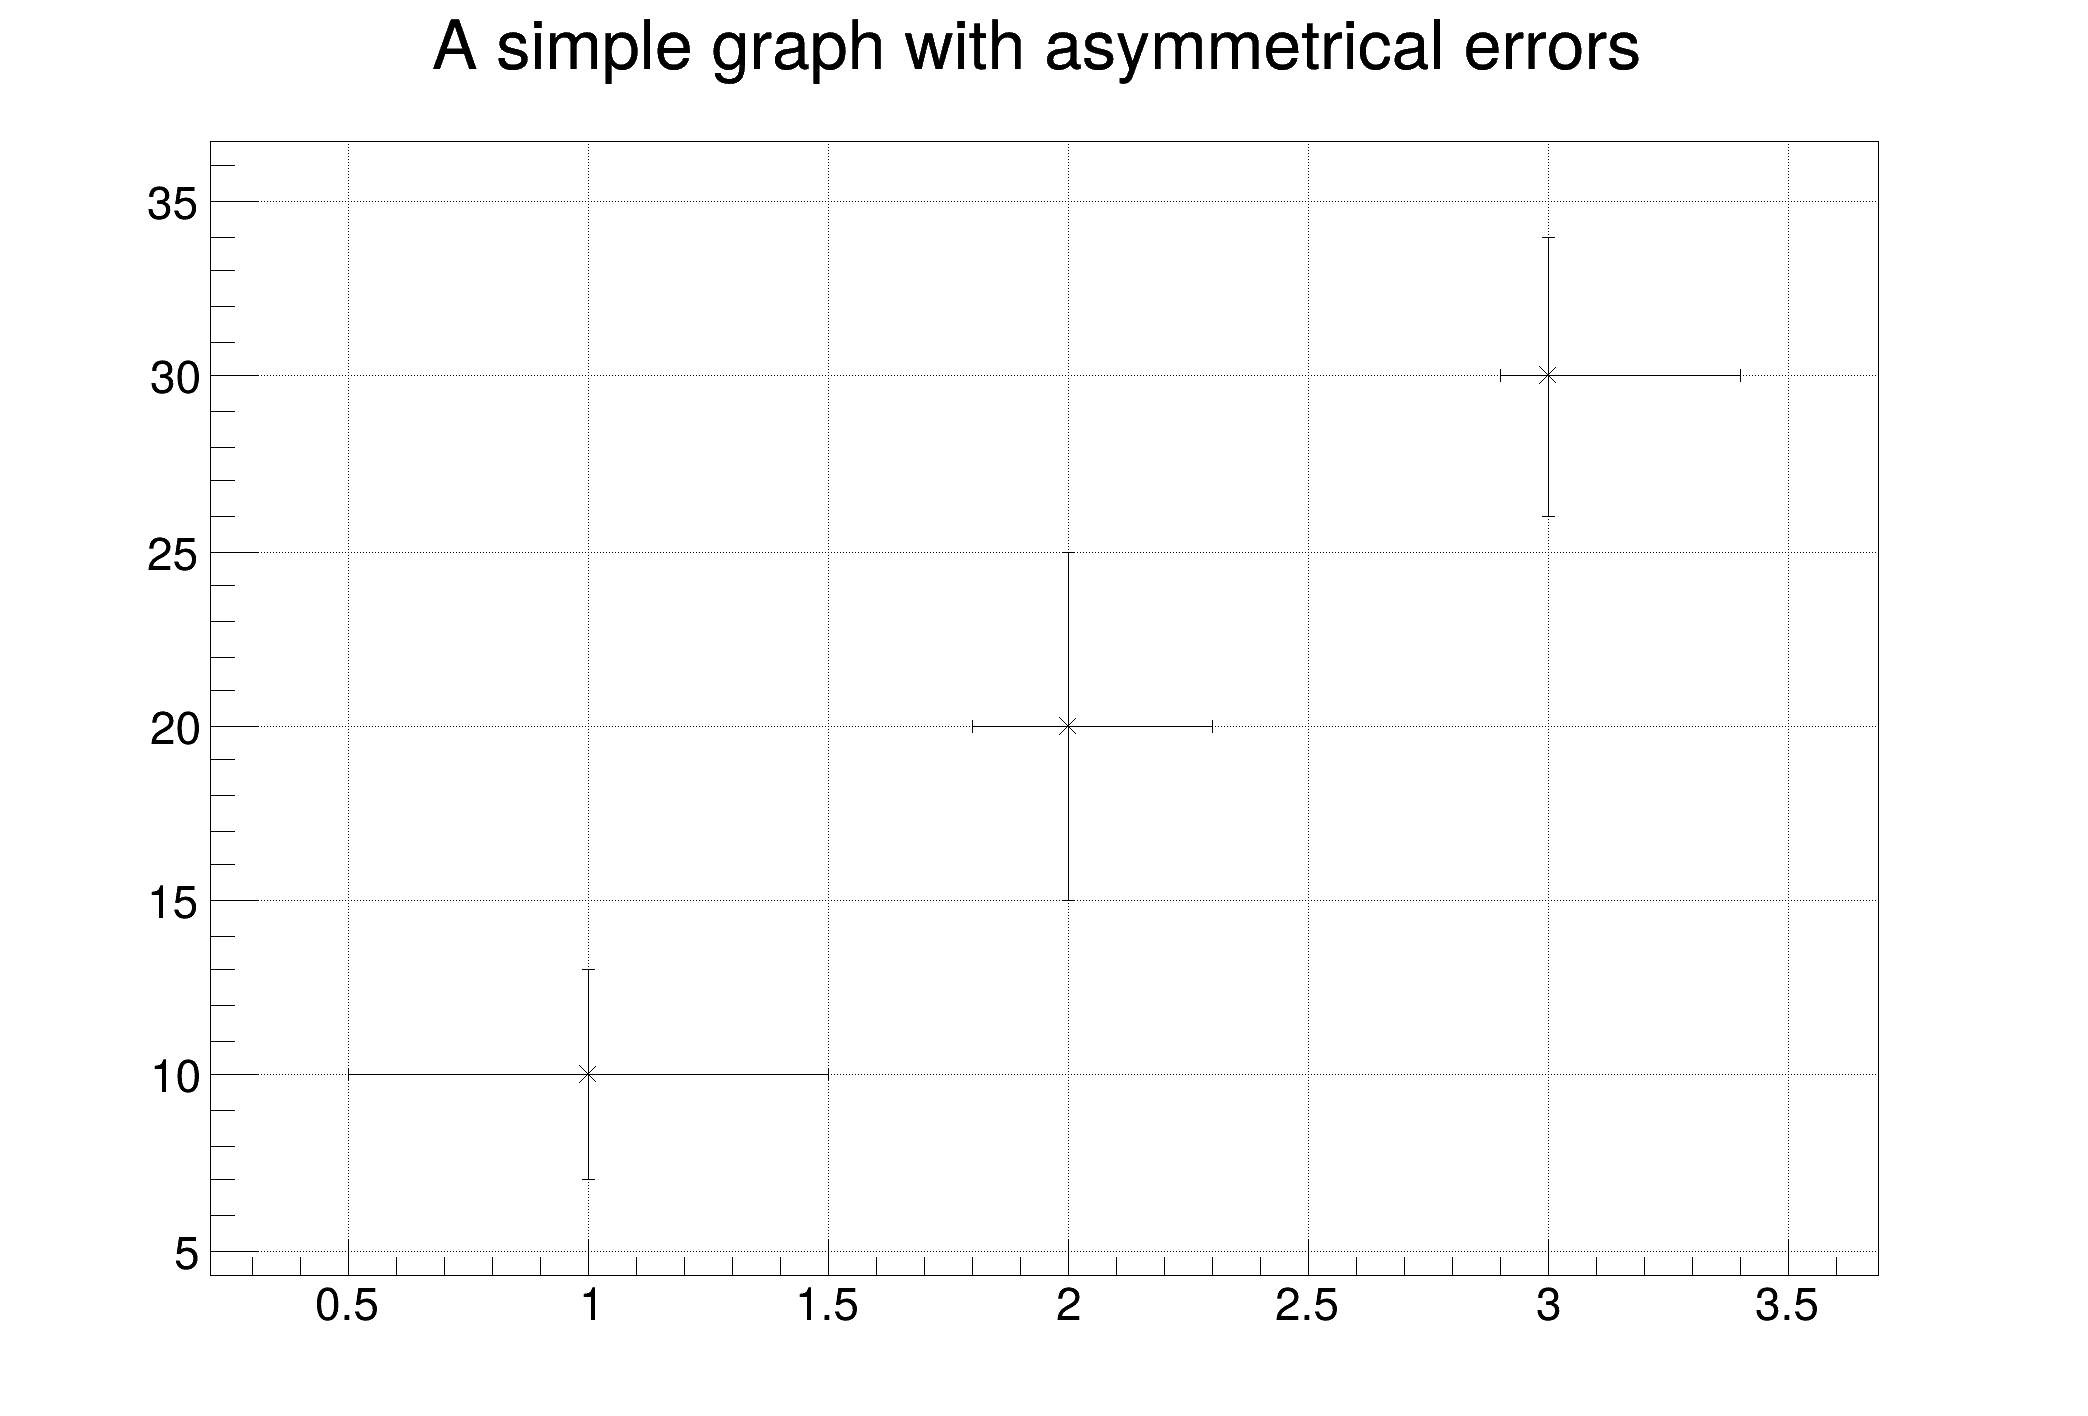 This tutorial demonstrates the use of TGraphAsymmErrors to plot a graph with asymmetrical errors on both the x and y axes. This tutorial demonstrates the use of TGraphAsymmErrors to plot a graph with asymmetrical errors on both the x and y axes. | |
| gr005_apply.C | |
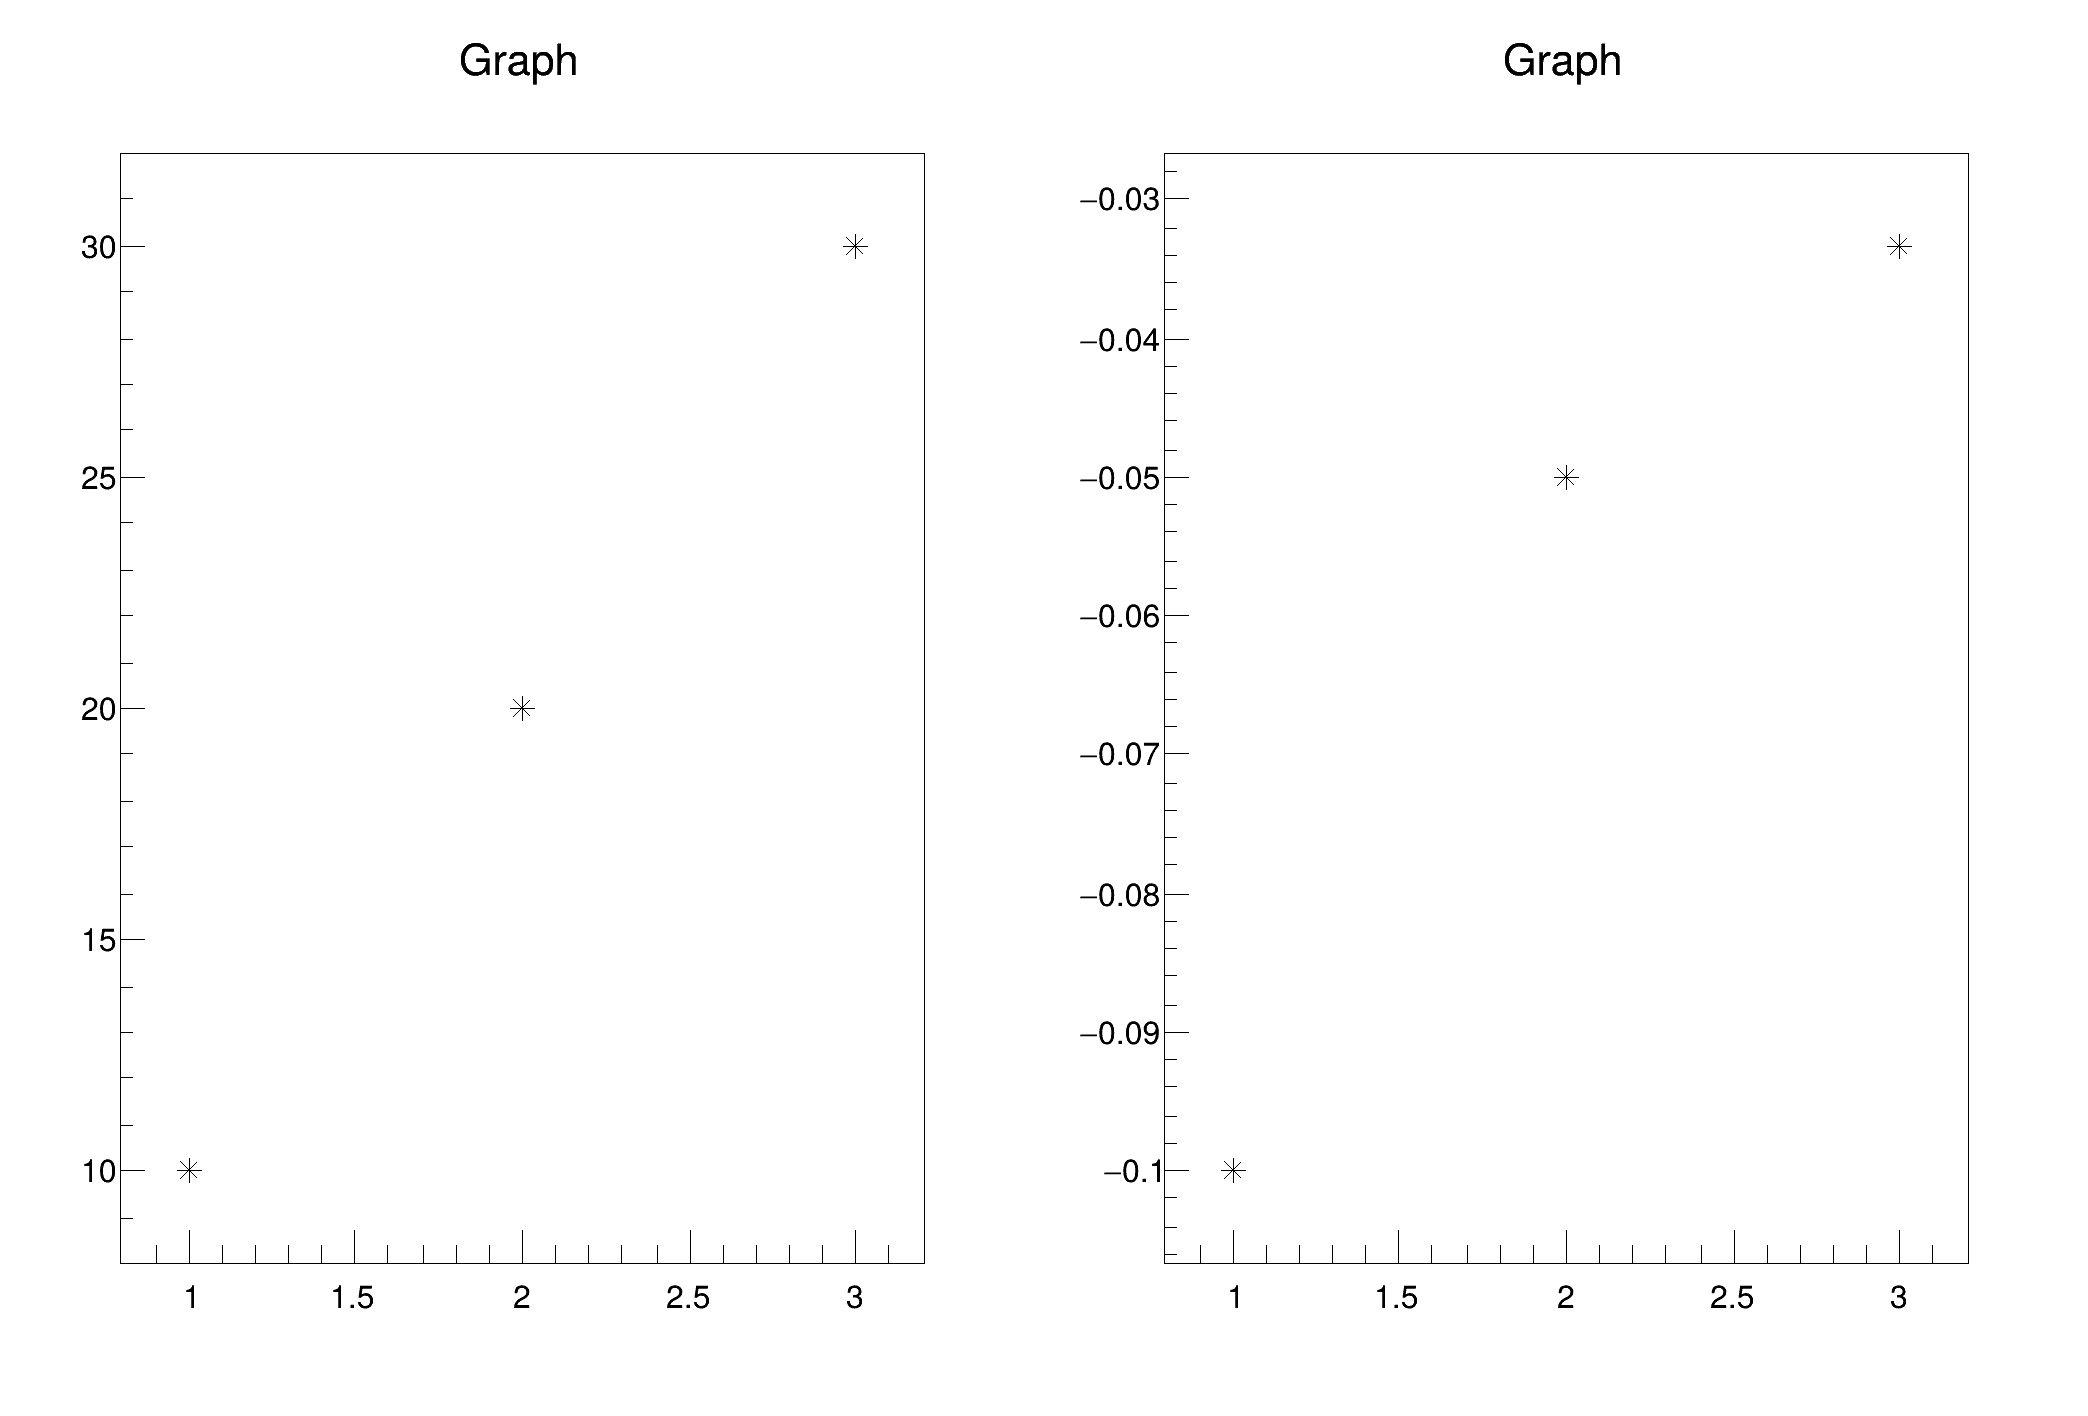 A macro to demonstrate the functionality of TGraph::Apply() method. A macro to demonstrate the functionality of TGraph::Apply() method. | |
| gr005_apply.py | |
 A macro to demonstrate the functionality of TGraph::Apply() method. A macro to demonstrate the functionality of TGraph::Apply() method. | |
| gr006_scatter.C | |
 Draw a scatter plot for 4 variables, mapped to: x, y, marker colour and marker size. Draw a scatter plot for 4 variables, mapped to: x, y, marker colour and marker size. | |
| gr006_scatter.py | |
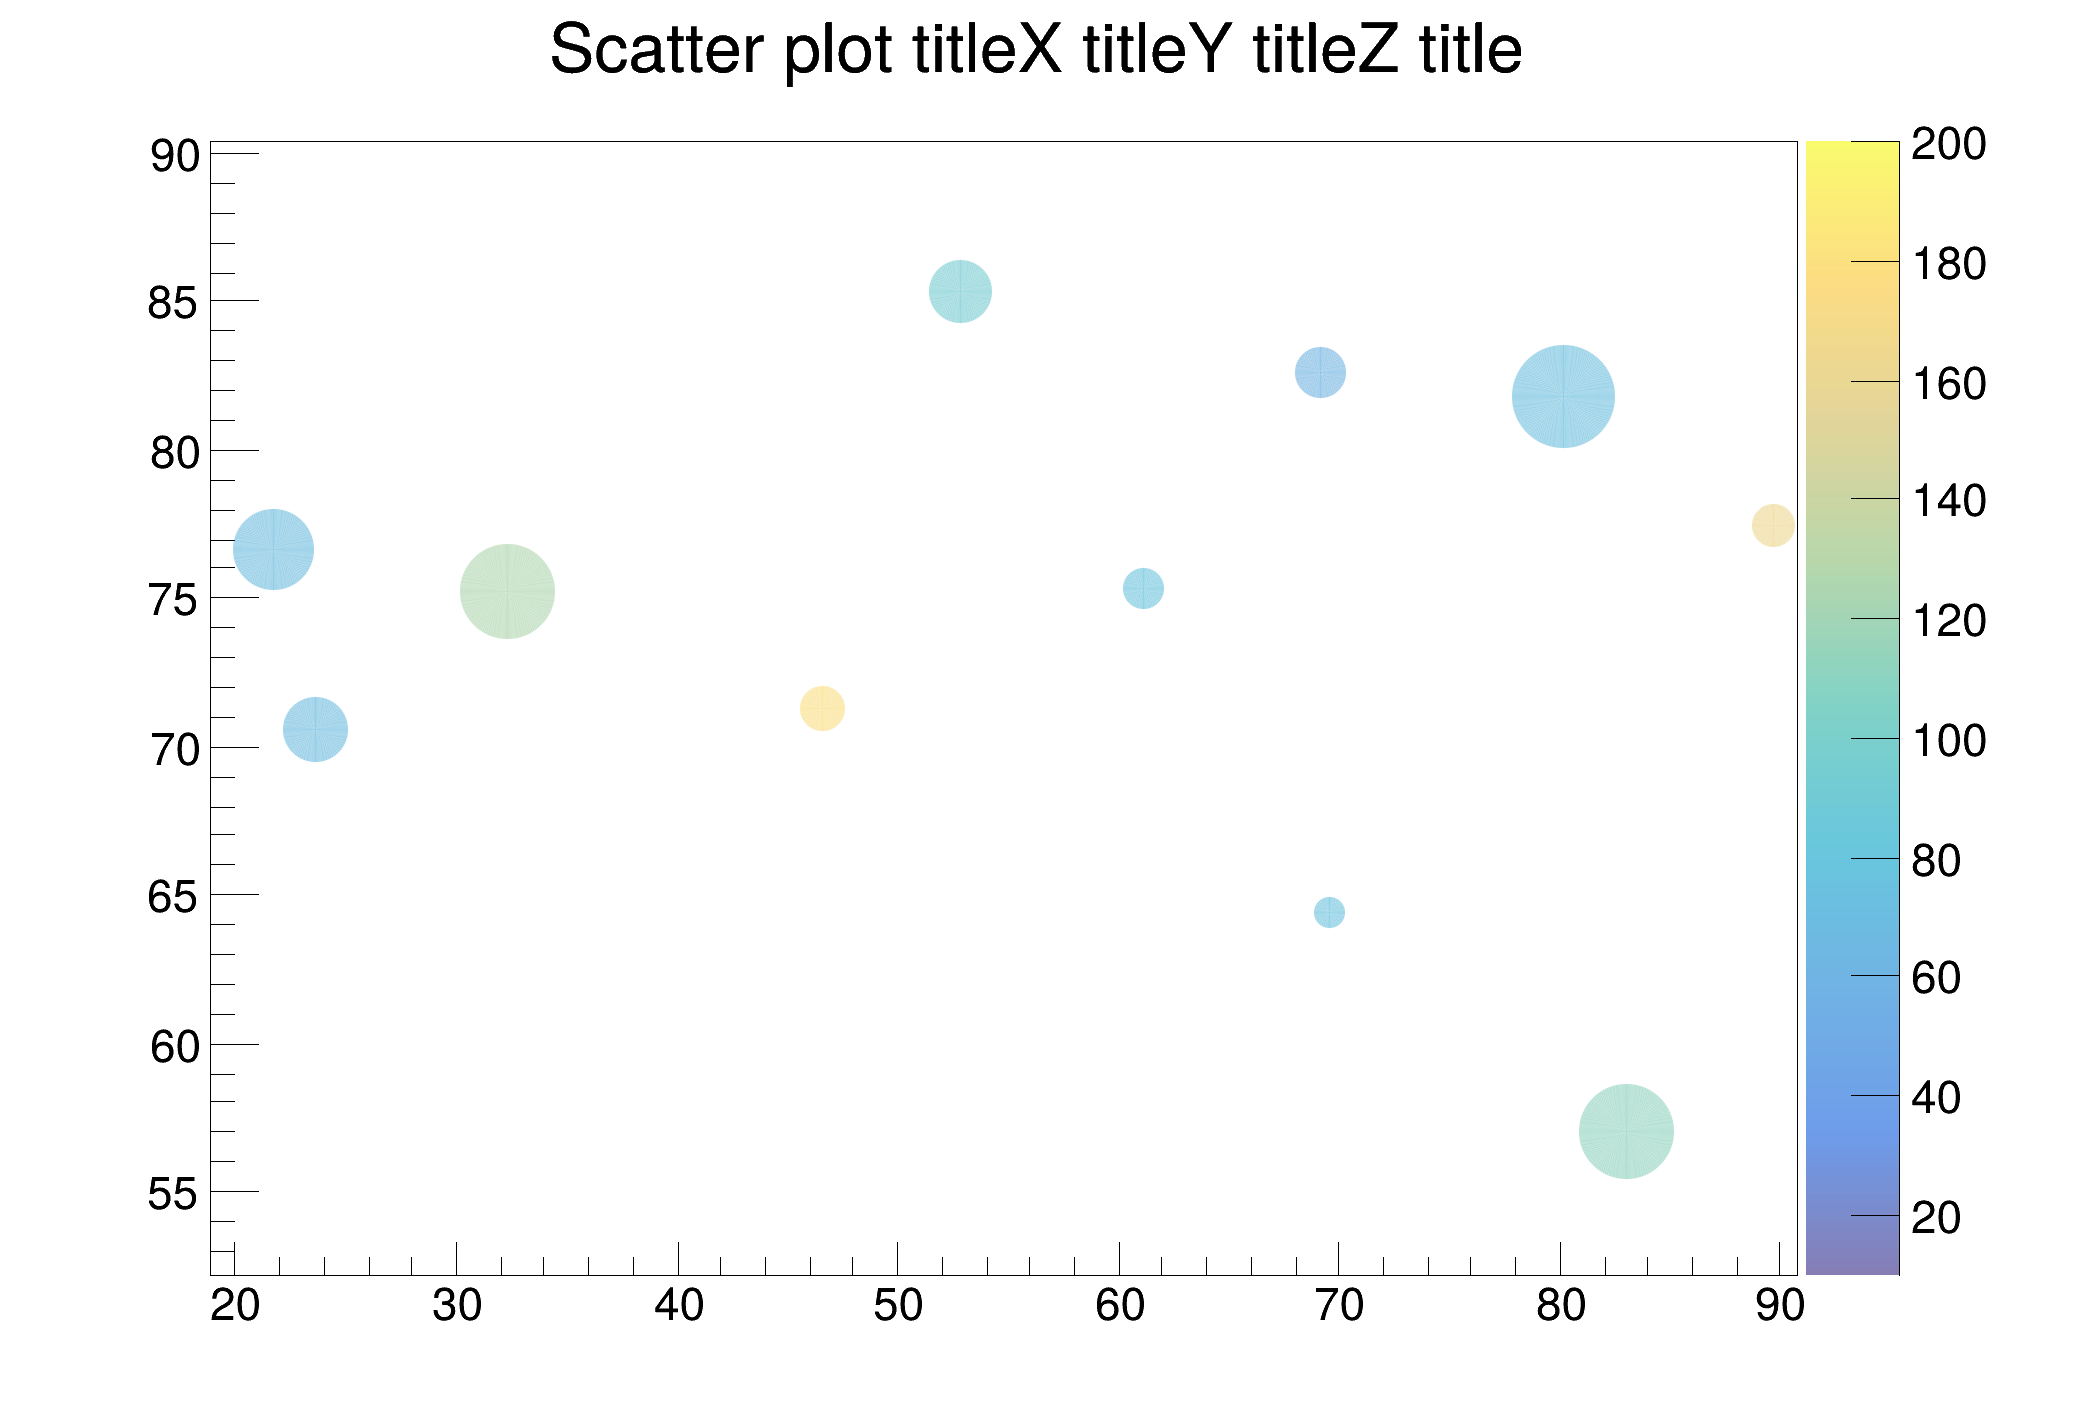 Draw a scatter plot for 4 variables, mapped to: x, y, marker colour and marker size. Draw a scatter plot for 4 variables, mapped to: x, y, marker colour and marker size. | |
| gr007_multigraph.C | |
 TMultiGraph is used to combine multiple graphs into one plot. TMultiGraph is used to combine multiple graphs into one plot. | |
| gr007_multigraph.py | |
 TMultiGraph is used to combine multiple graphs into one plot. TMultiGraph is used to combine multiple graphs into one plot. | |
| gr008_multierrors.C | |
 Draw a graph with multiple errors. Draw a graph with multiple errors. | |
| gr009_bent_err.C | |
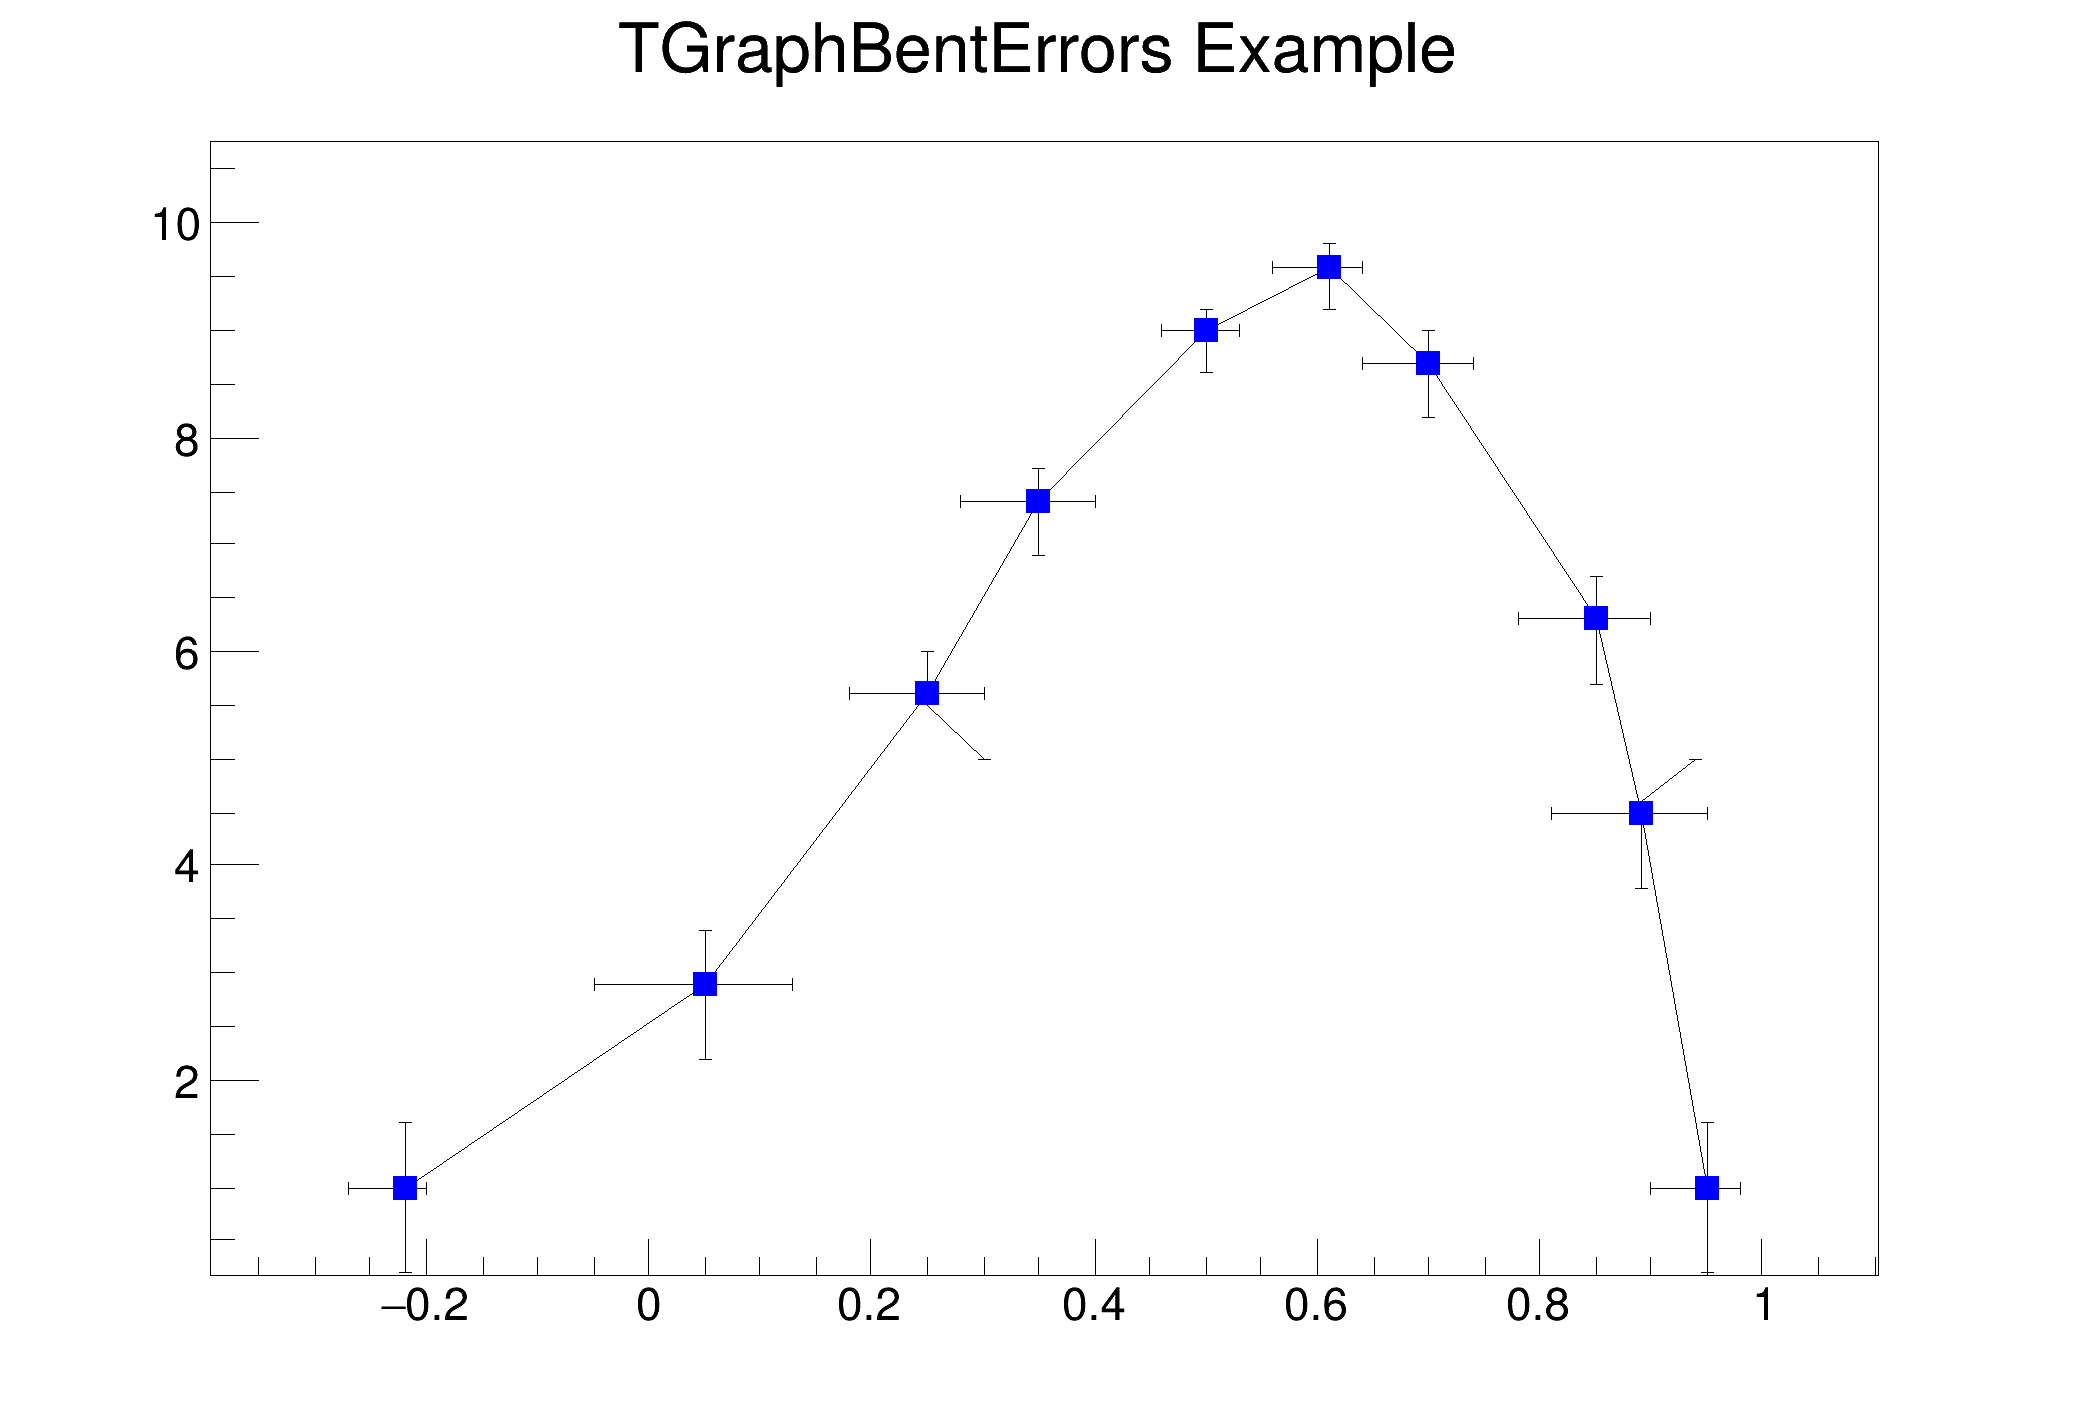 Graph with bent error bars. Graph with bent error bars. | |
| gr009_bent_err.py | |
| Graph with bent error bars. | |
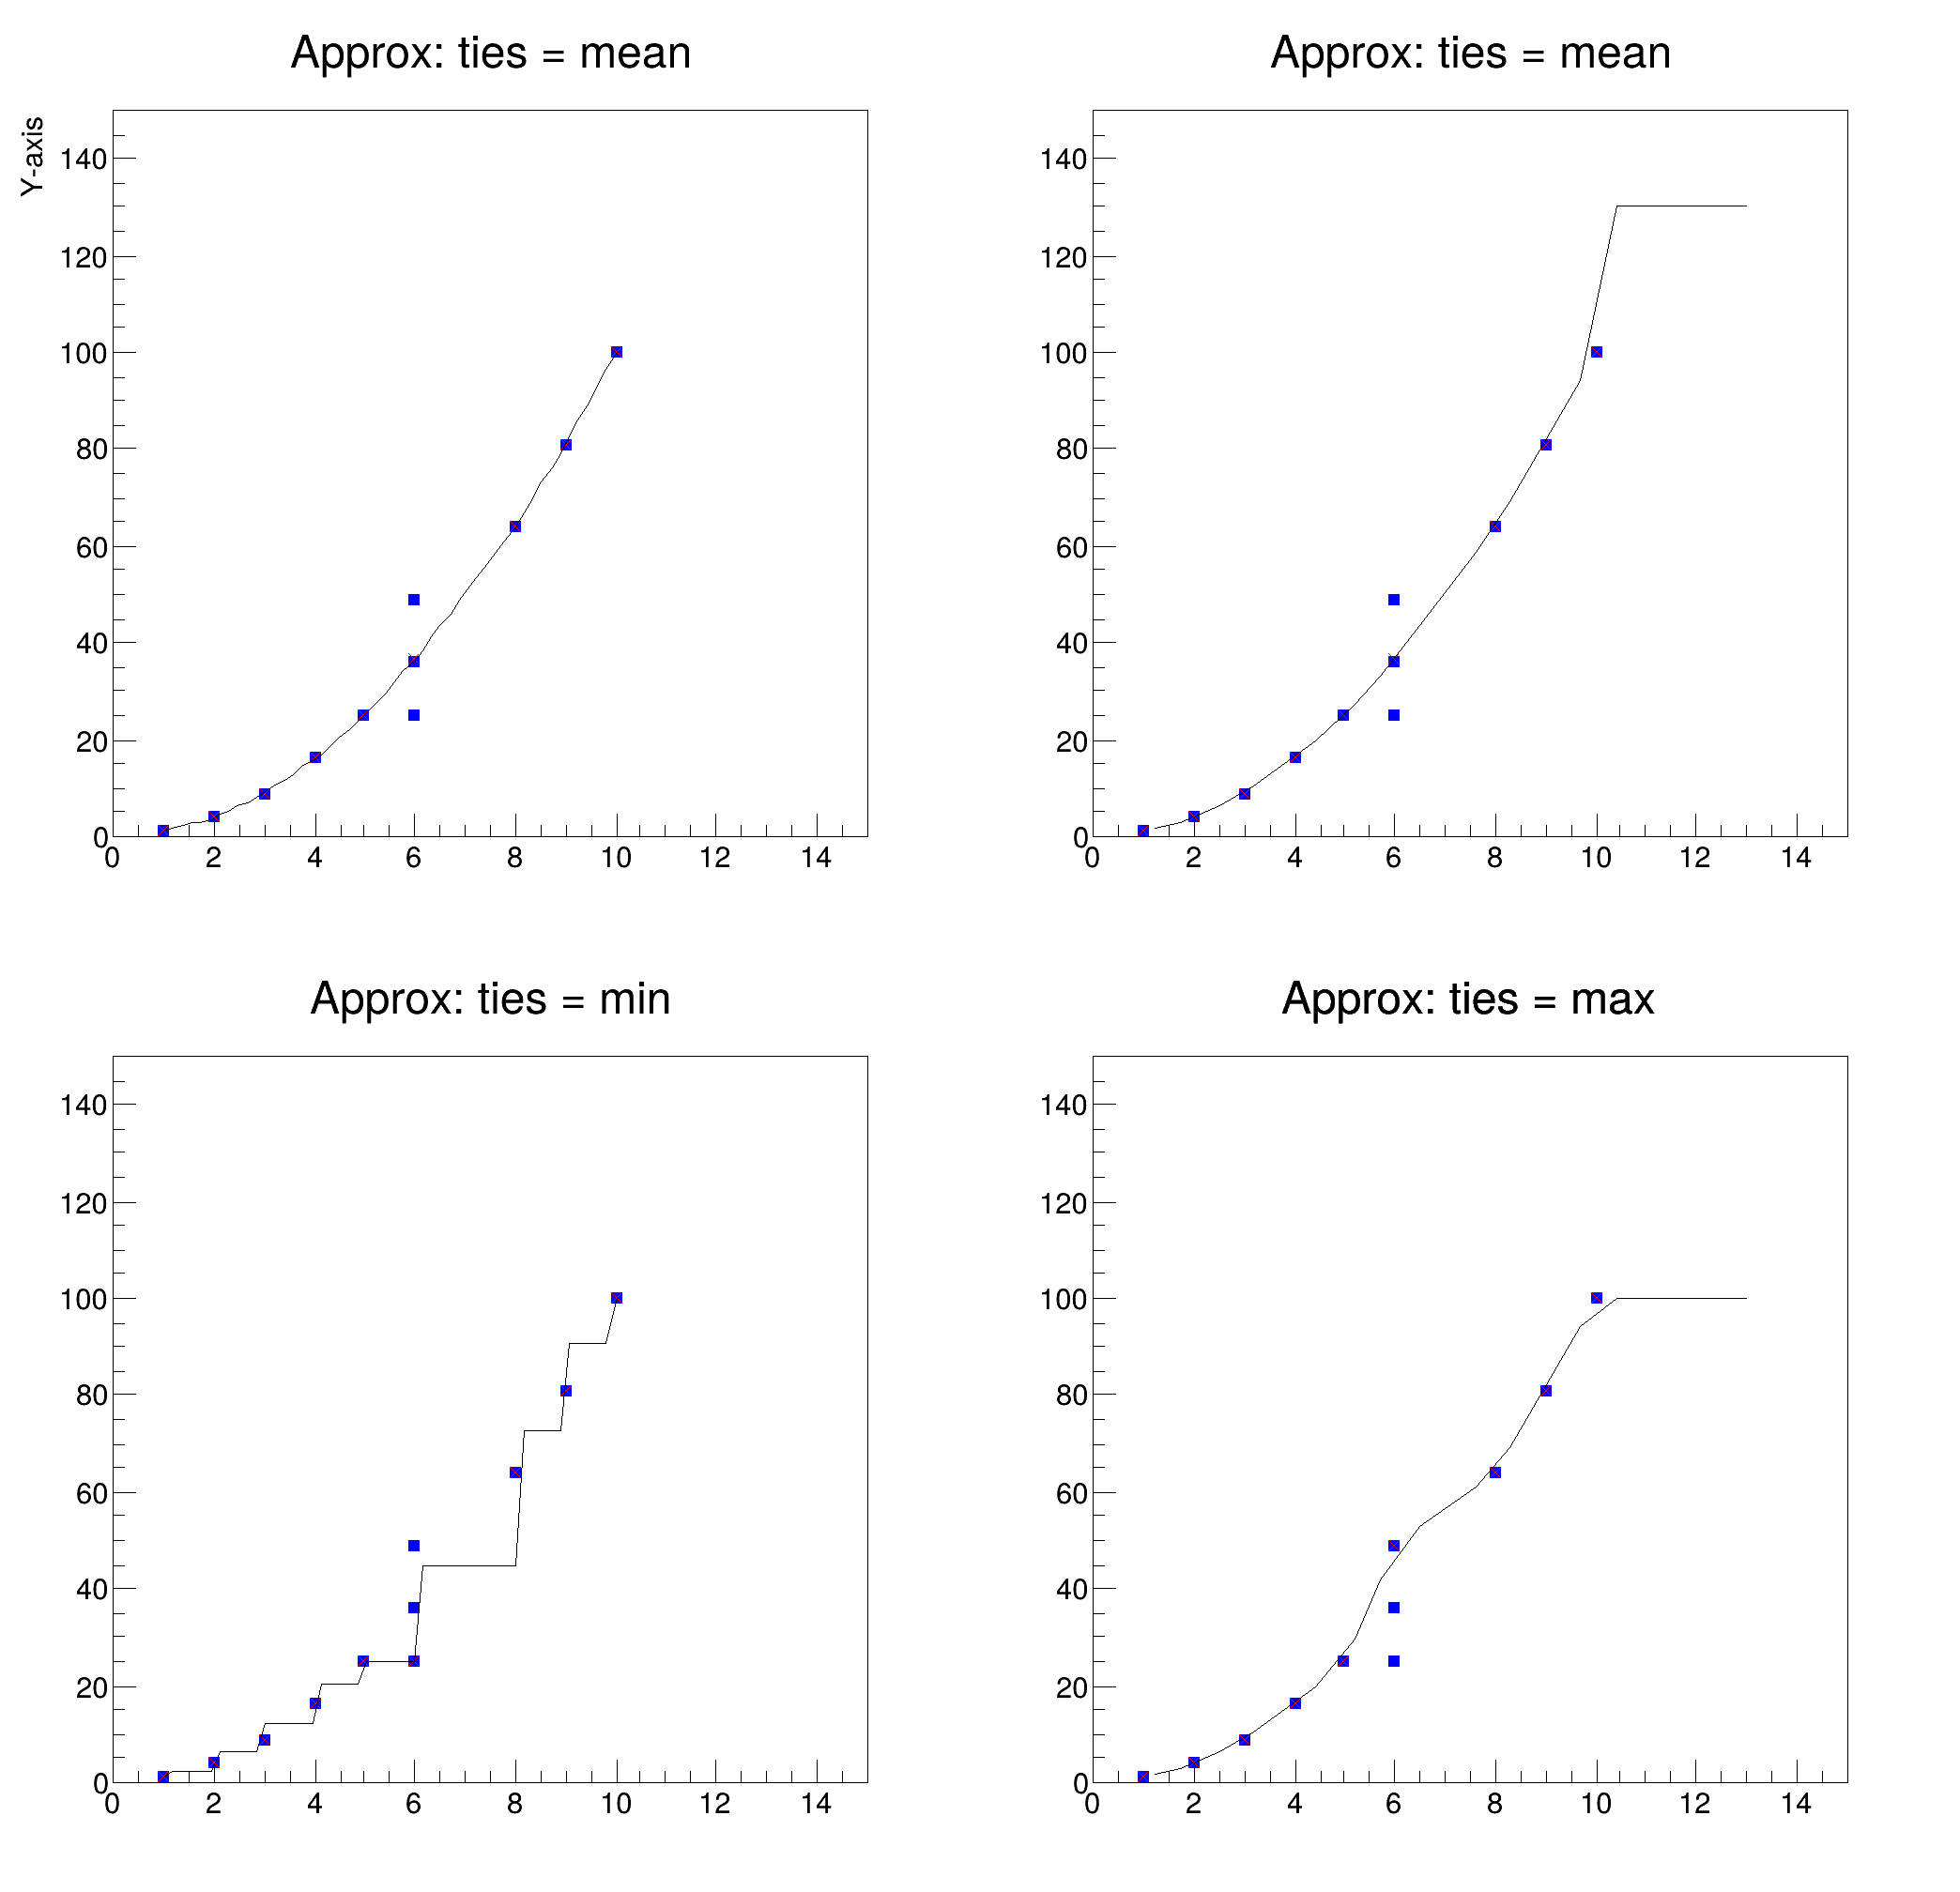
| gr010_approx_smooth.C | |
 Create a TGraphSmooth and show the usage of the interpolation function Approx. Create a TGraphSmooth and show the usage of the interpolation function Approx. | |
| gr010_approx_smooth.py | |
 Create a TGraphSmooth and show the usage of the interpolation function Approx. Create a TGraphSmooth and show the usage of the interpolation function Approx. | |
| gr011_graph2d_errorsfit.C | |
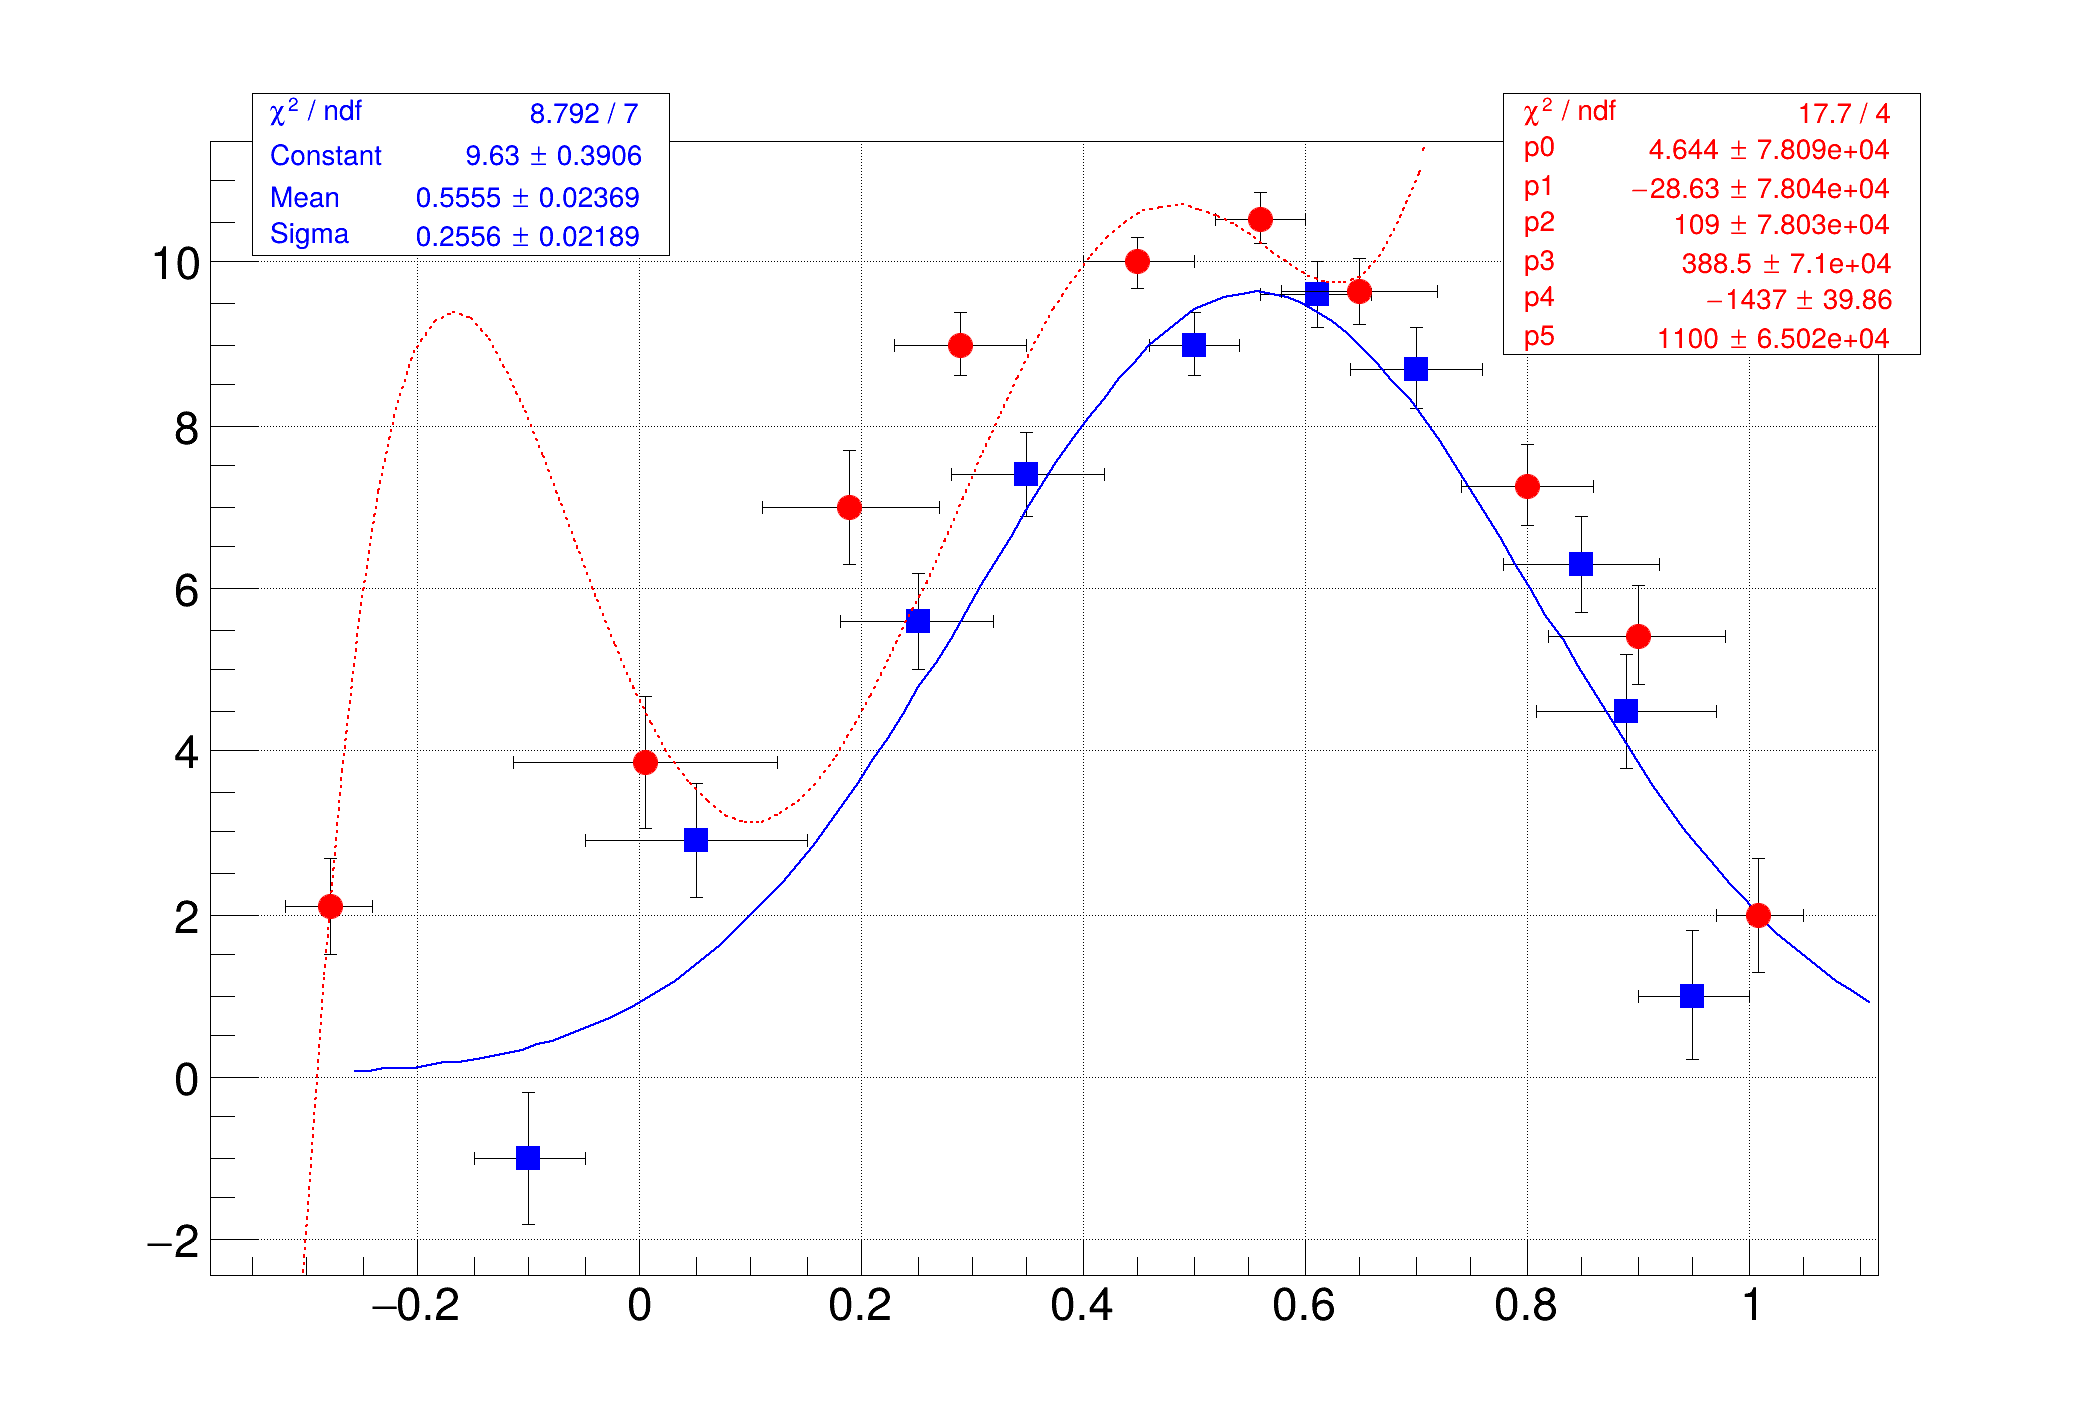
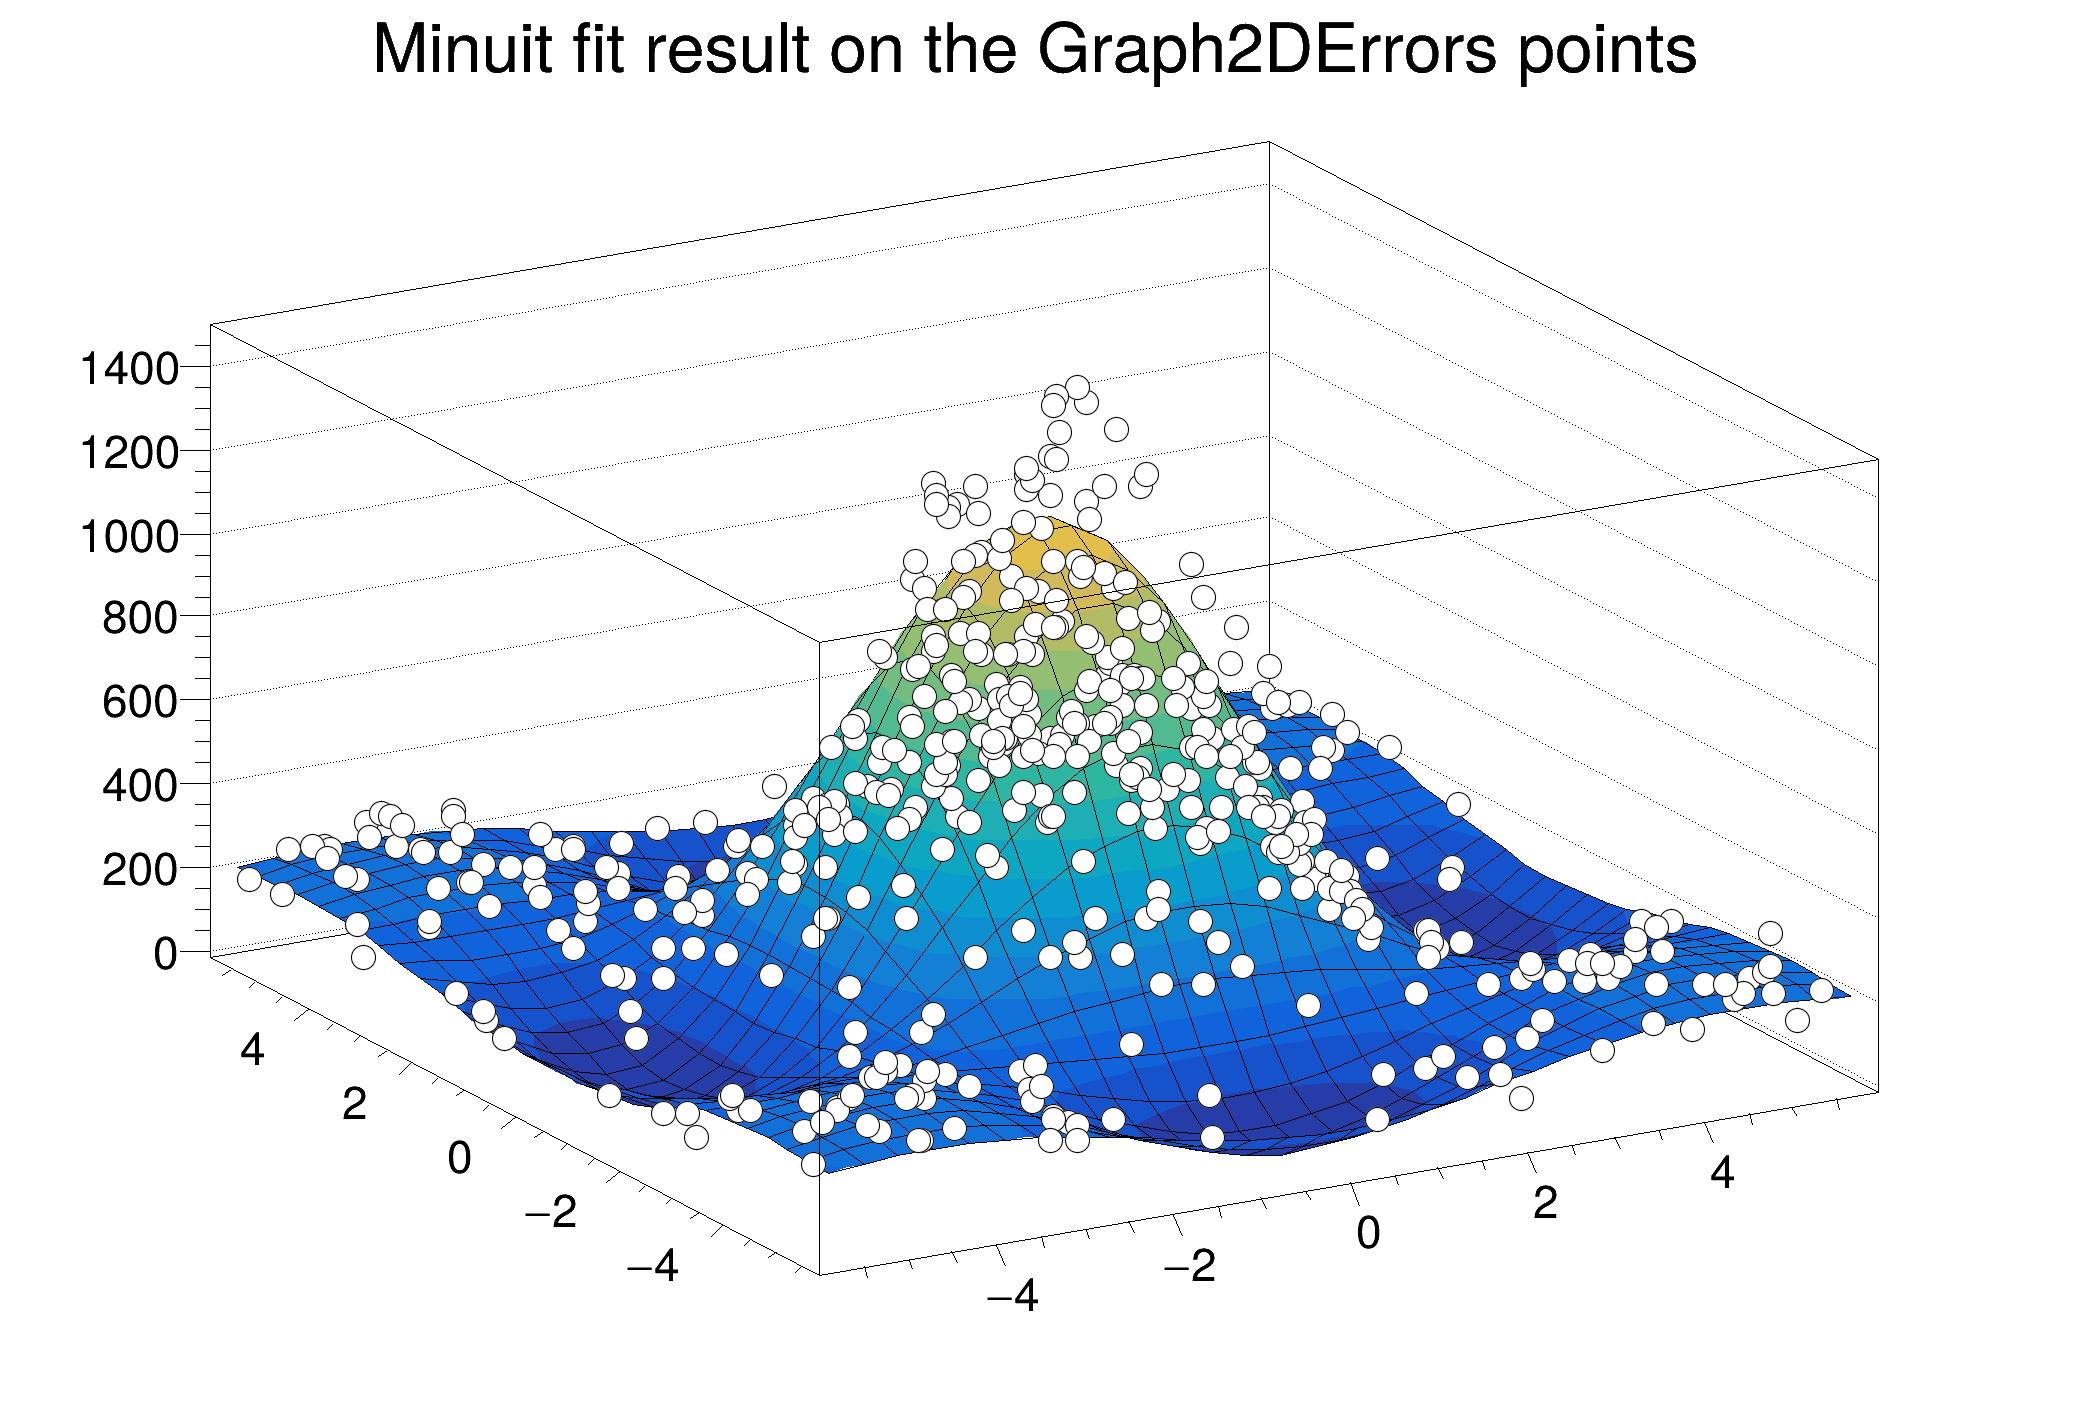 Create, draw and fit a TGraph2DErrors. Create, draw and fit a TGraph2DErrors. | |
| gr011_graph2d_errorsfit.py | |
 Create, draw and fit a TGraph2DErrors. Create, draw and fit a TGraph2DErrors. | |
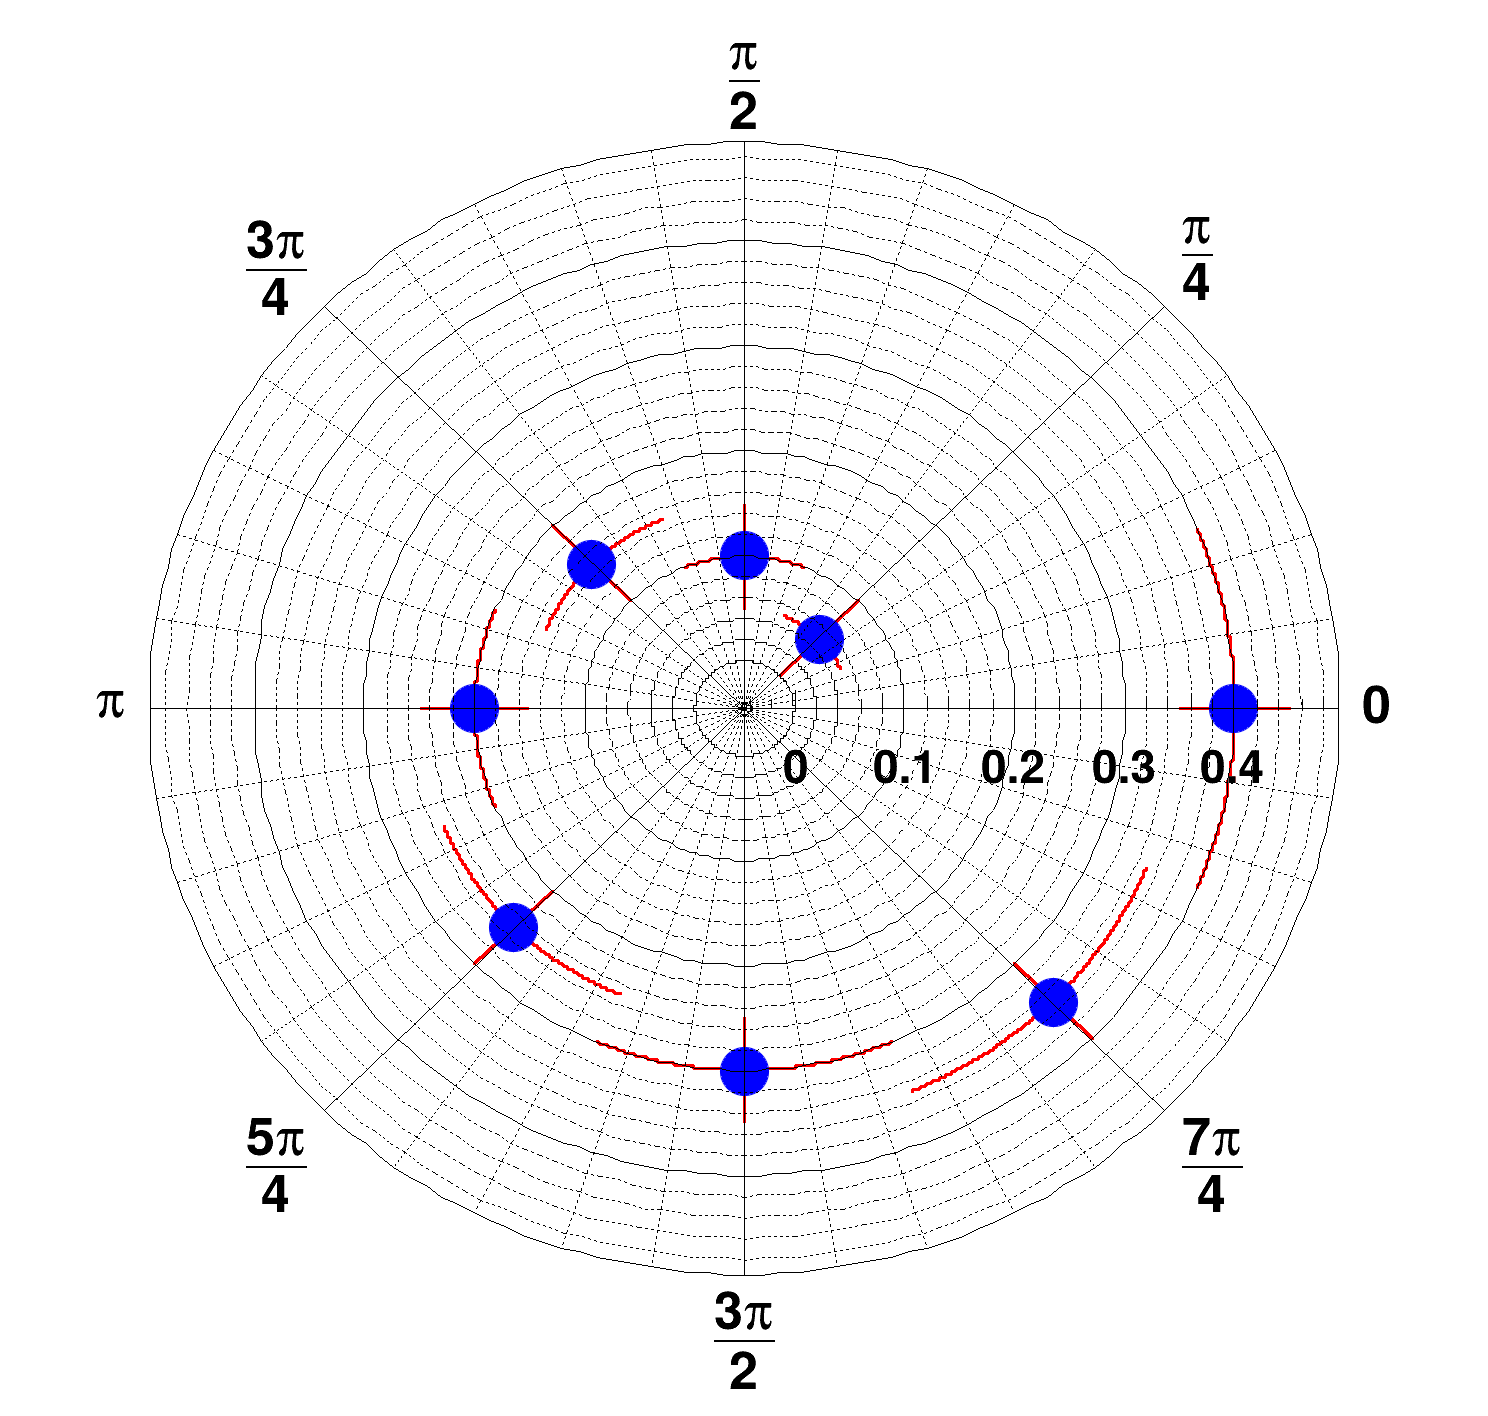
| gr012_polar.C | |
 Create and draw a polar graph. Create and draw a polar graph. | |
| gr012_polar.py | |
 Create and draw a polar graph. Create and draw a polar graph. | |
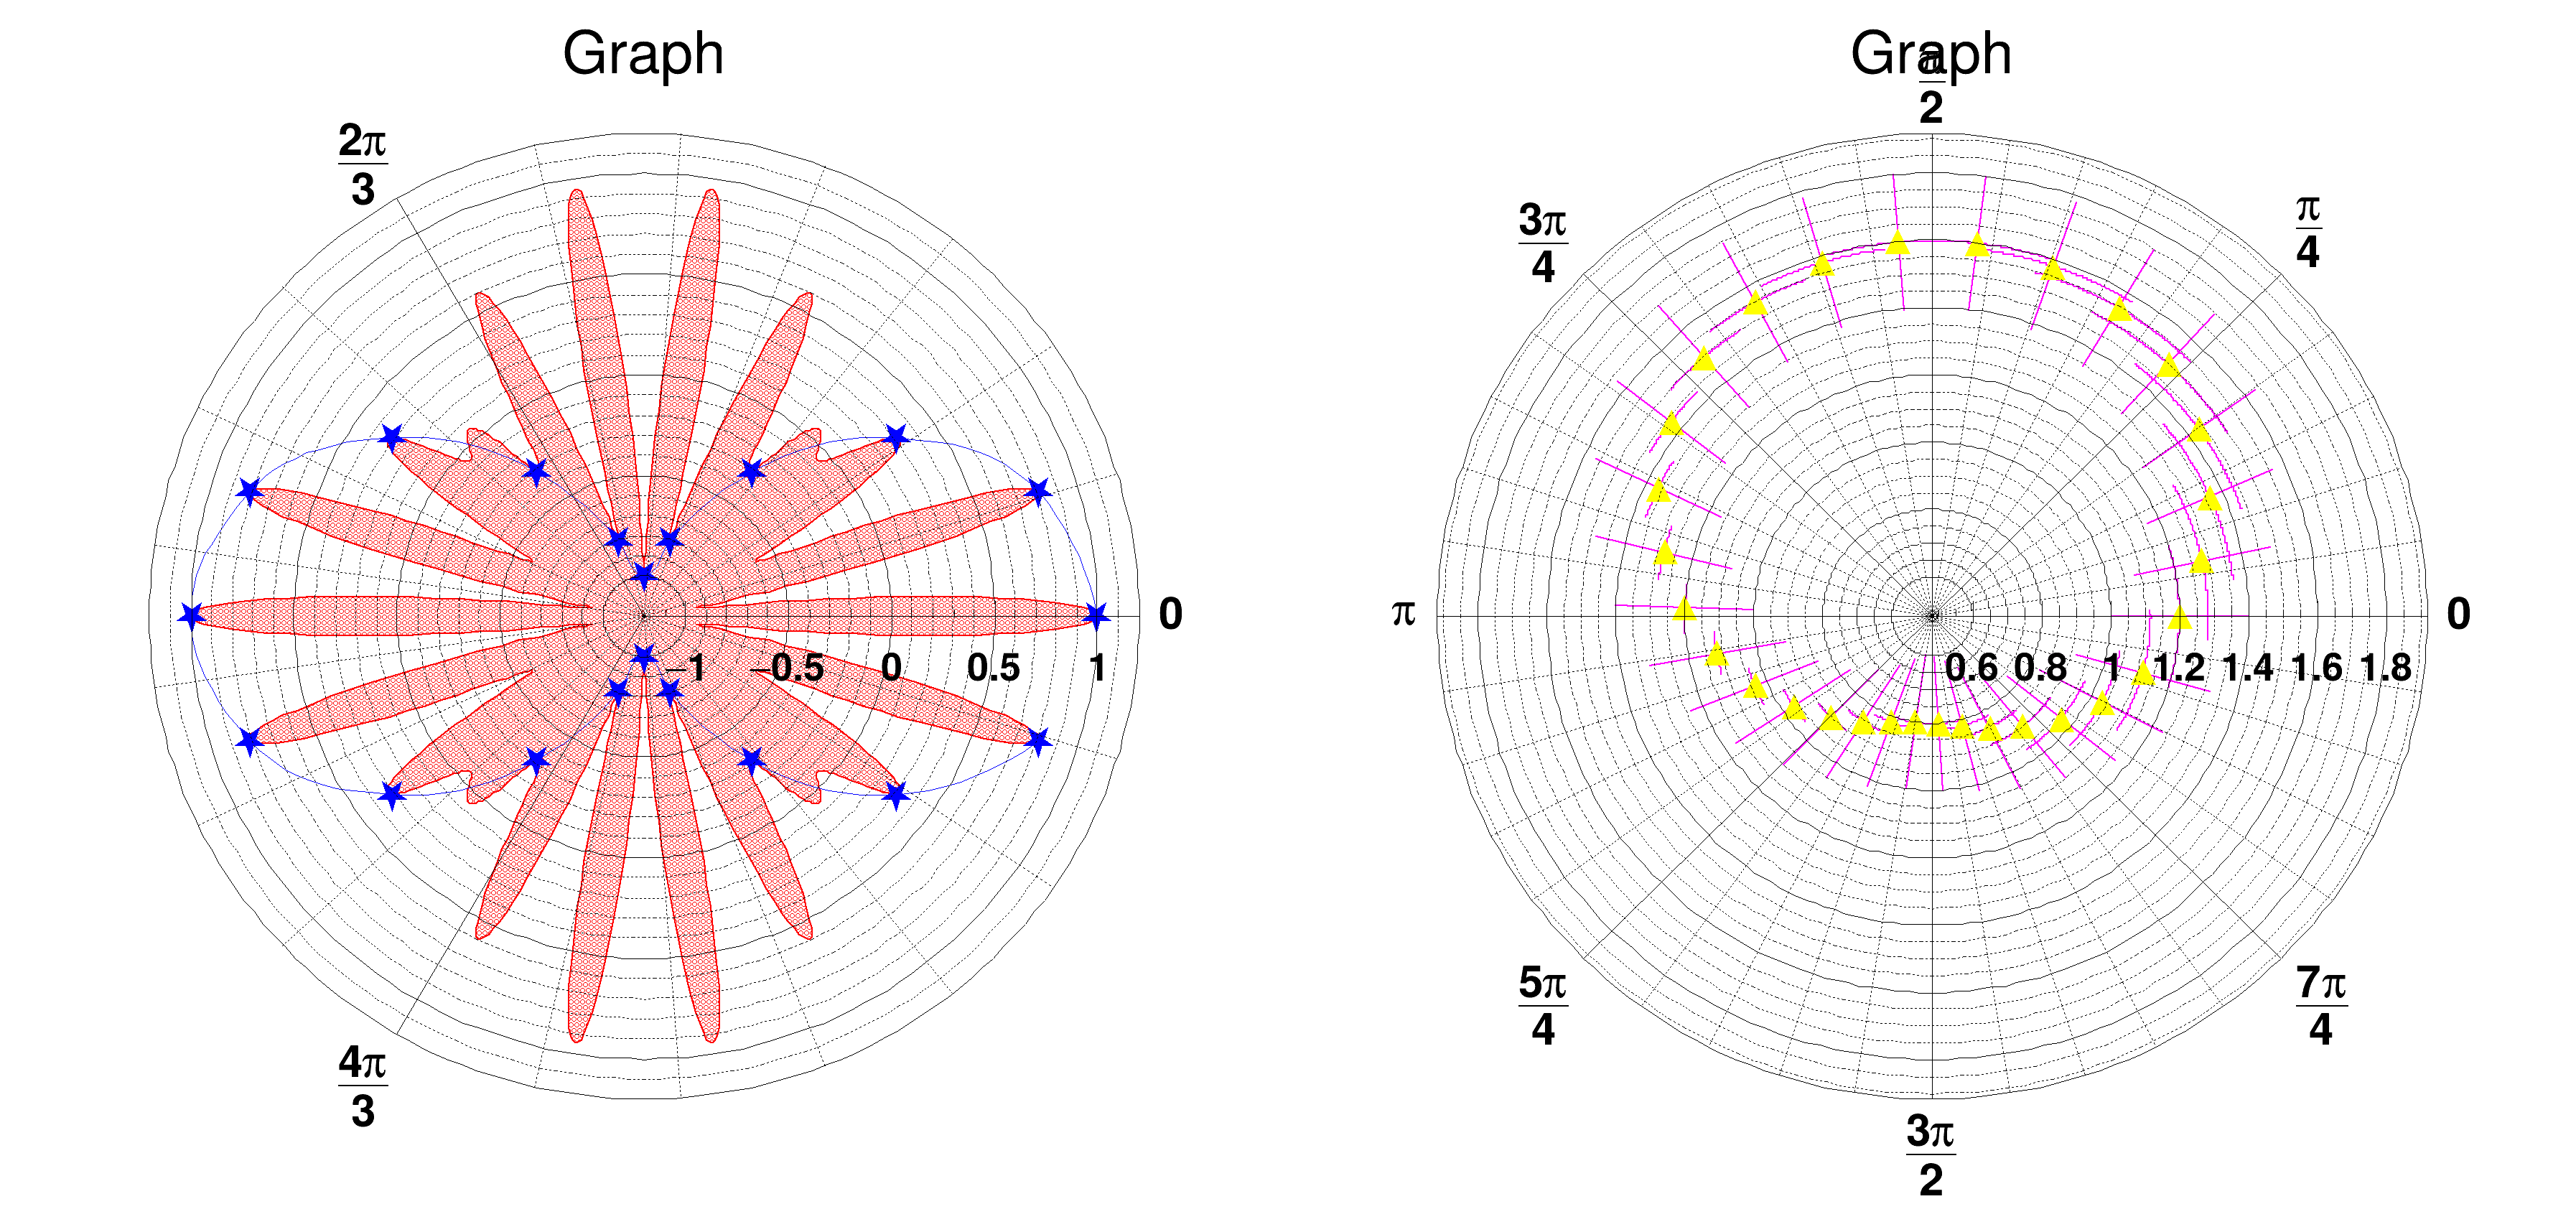
| gr013_polar2.C | |
 Create and draw a polar graph with errors and polar axis in radians (PI fractions). Create and draw a polar graph with errors and polar axis in radians (PI fractions). | |
| gr013_polar2.py | |
 Create and draw a polar graph with errors and polar axis in radians (PI fractions). Create and draw a polar graph with errors and polar axis in radians (PI fractions). | |
| gr014_polar3.C | |
 Create a polar graph using a TF1 and draw it with PI axis. Create a polar graph using a TF1 and draw it with PI axis. | |
| gr014_polar3.py | |
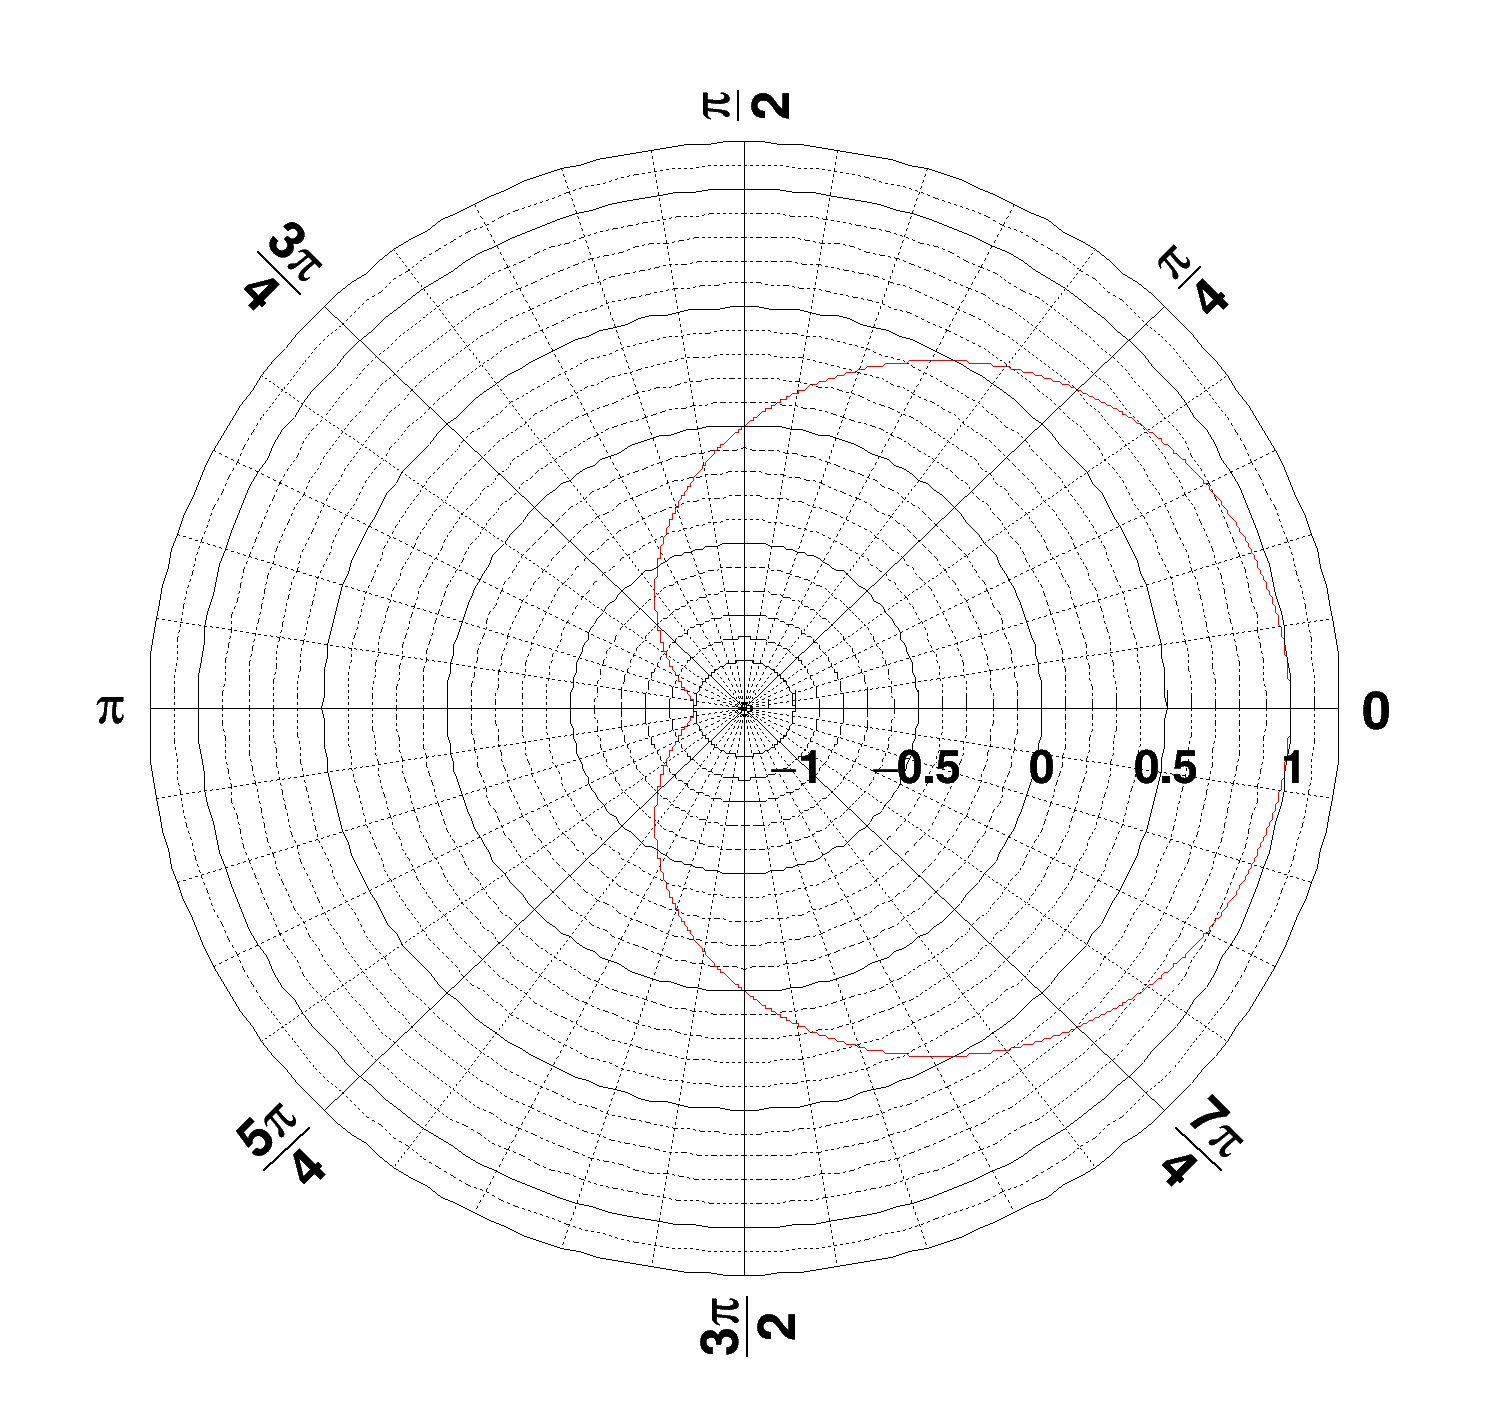 Create a polar graph using a TF1 and draw it with PI axis. Create a polar graph using a TF1 and draw it with PI axis. | |
| gr015_smooth.C | |
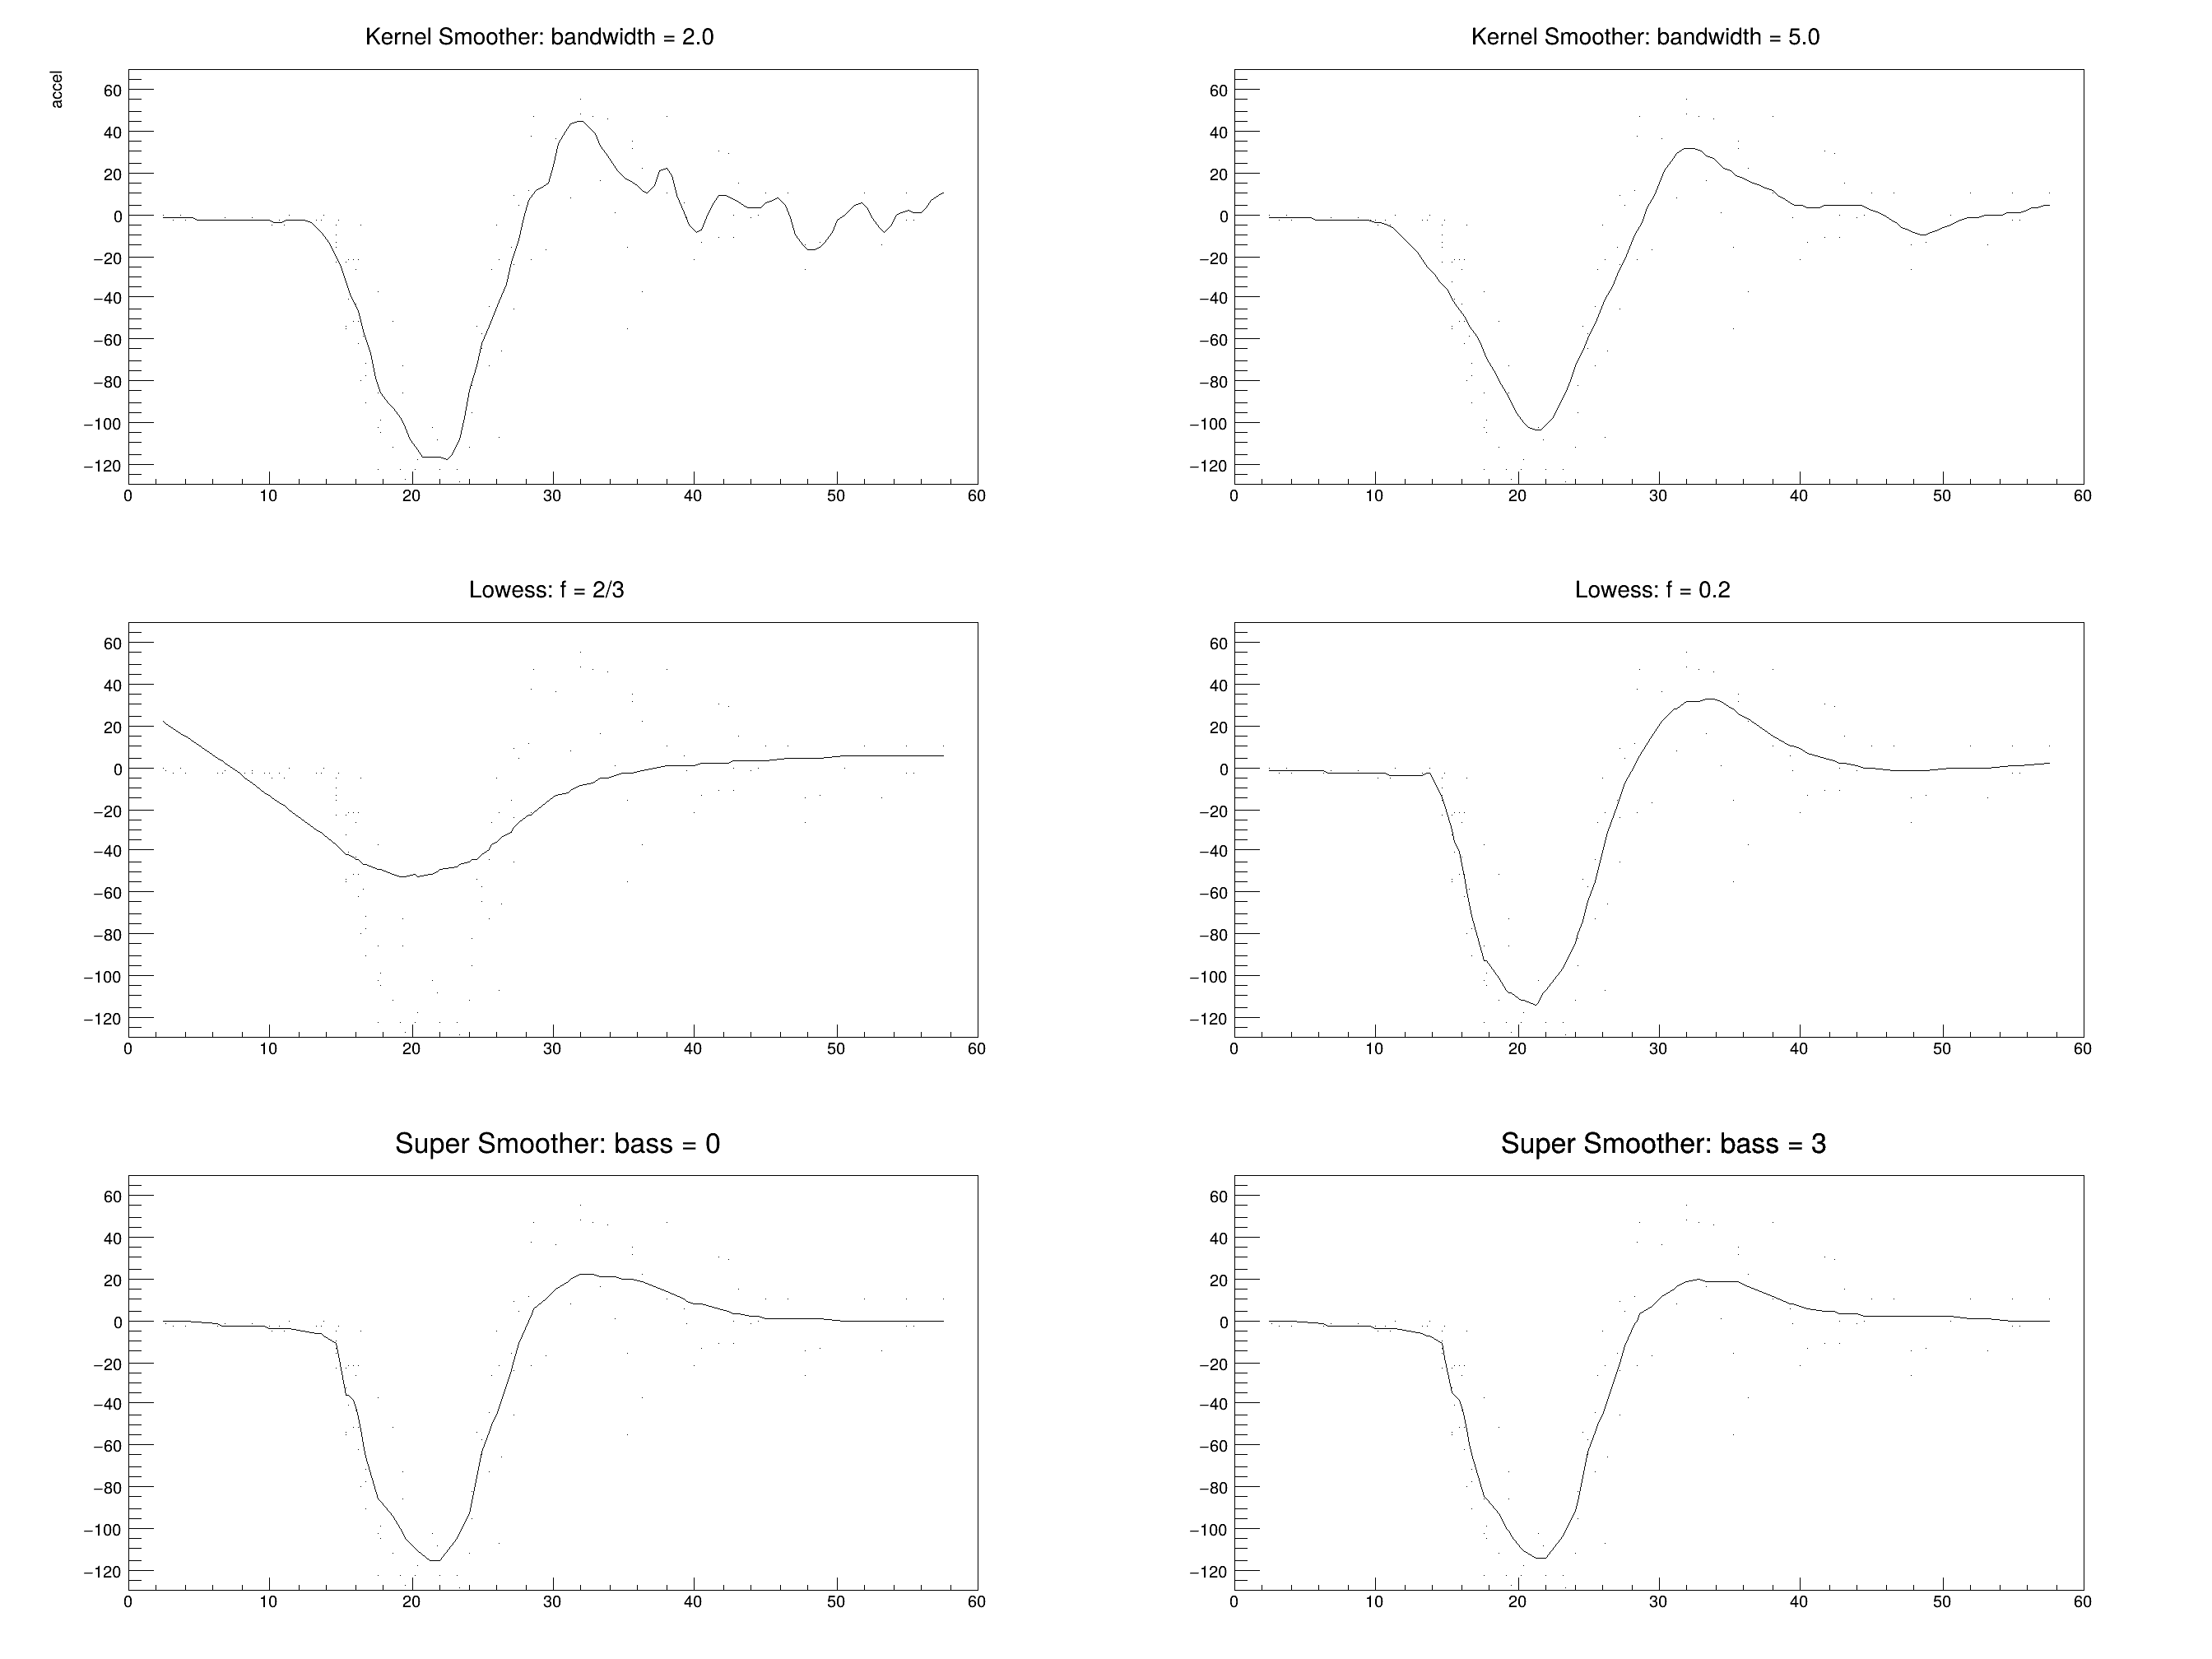 Show scatter plot smoothers: ksmooth, lowess, supsmu, as described in: Modern Applied Statistics with S-Plus, 3rd Edition W.N. Show scatter plot smoothers: ksmooth, lowess, supsmu, as described in: Modern Applied Statistics with S-Plus, 3rd Edition W.N. | |
| gr016_struct.C | |
| Draw a simple graph structure. | |
| gr017_time.C | |
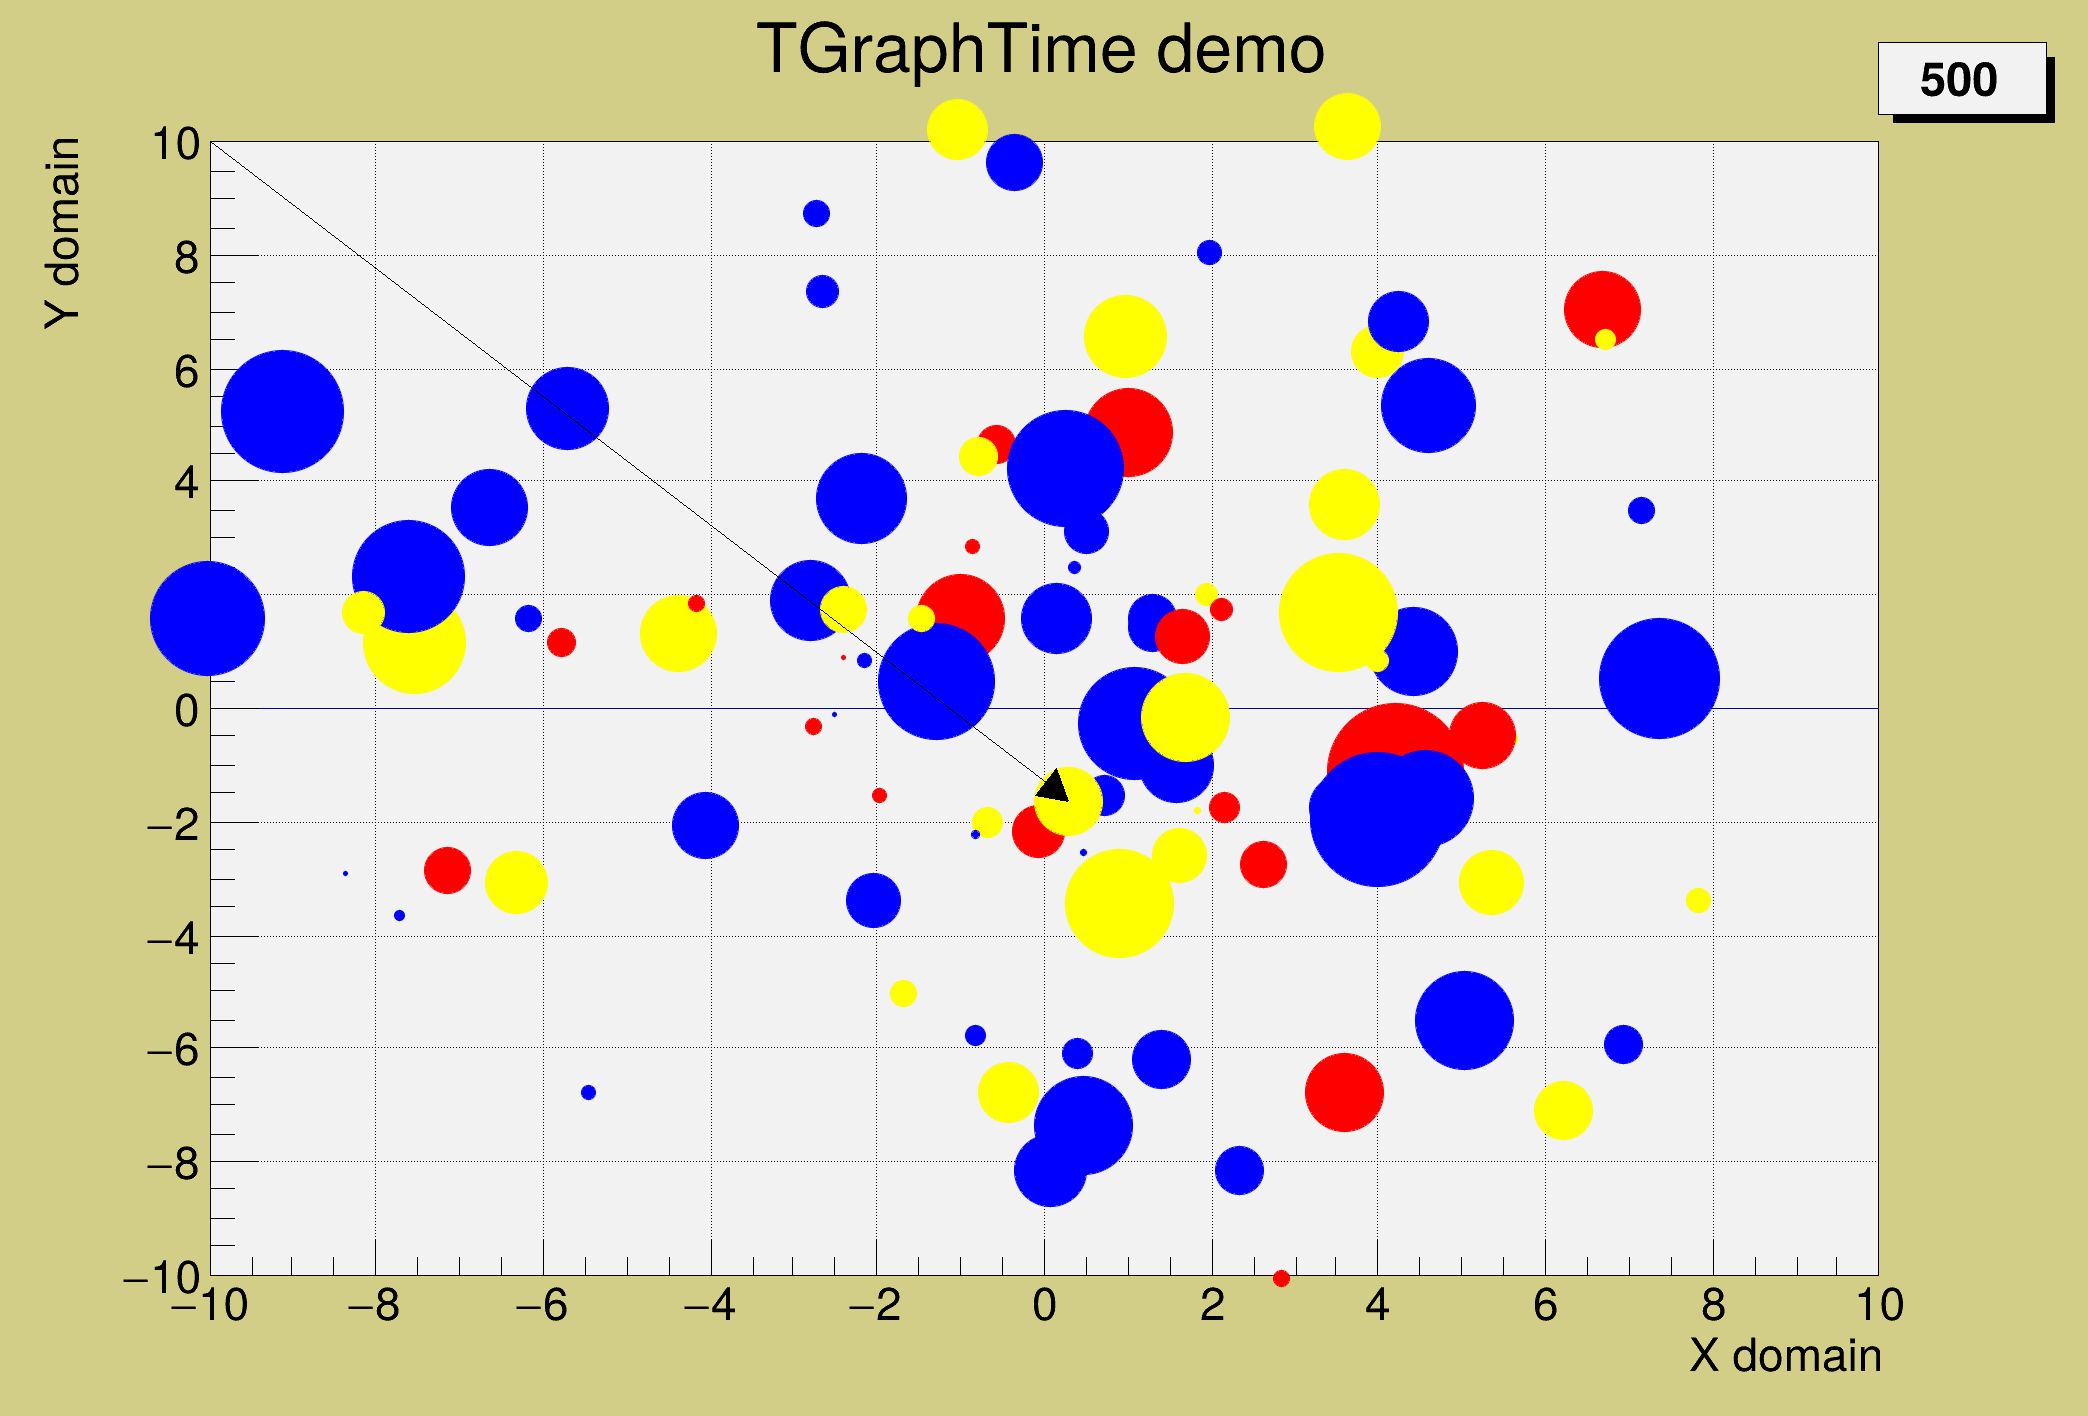 Example of TGraphTime. Example of TGraphTime. | |
| gr018_time2.C | |
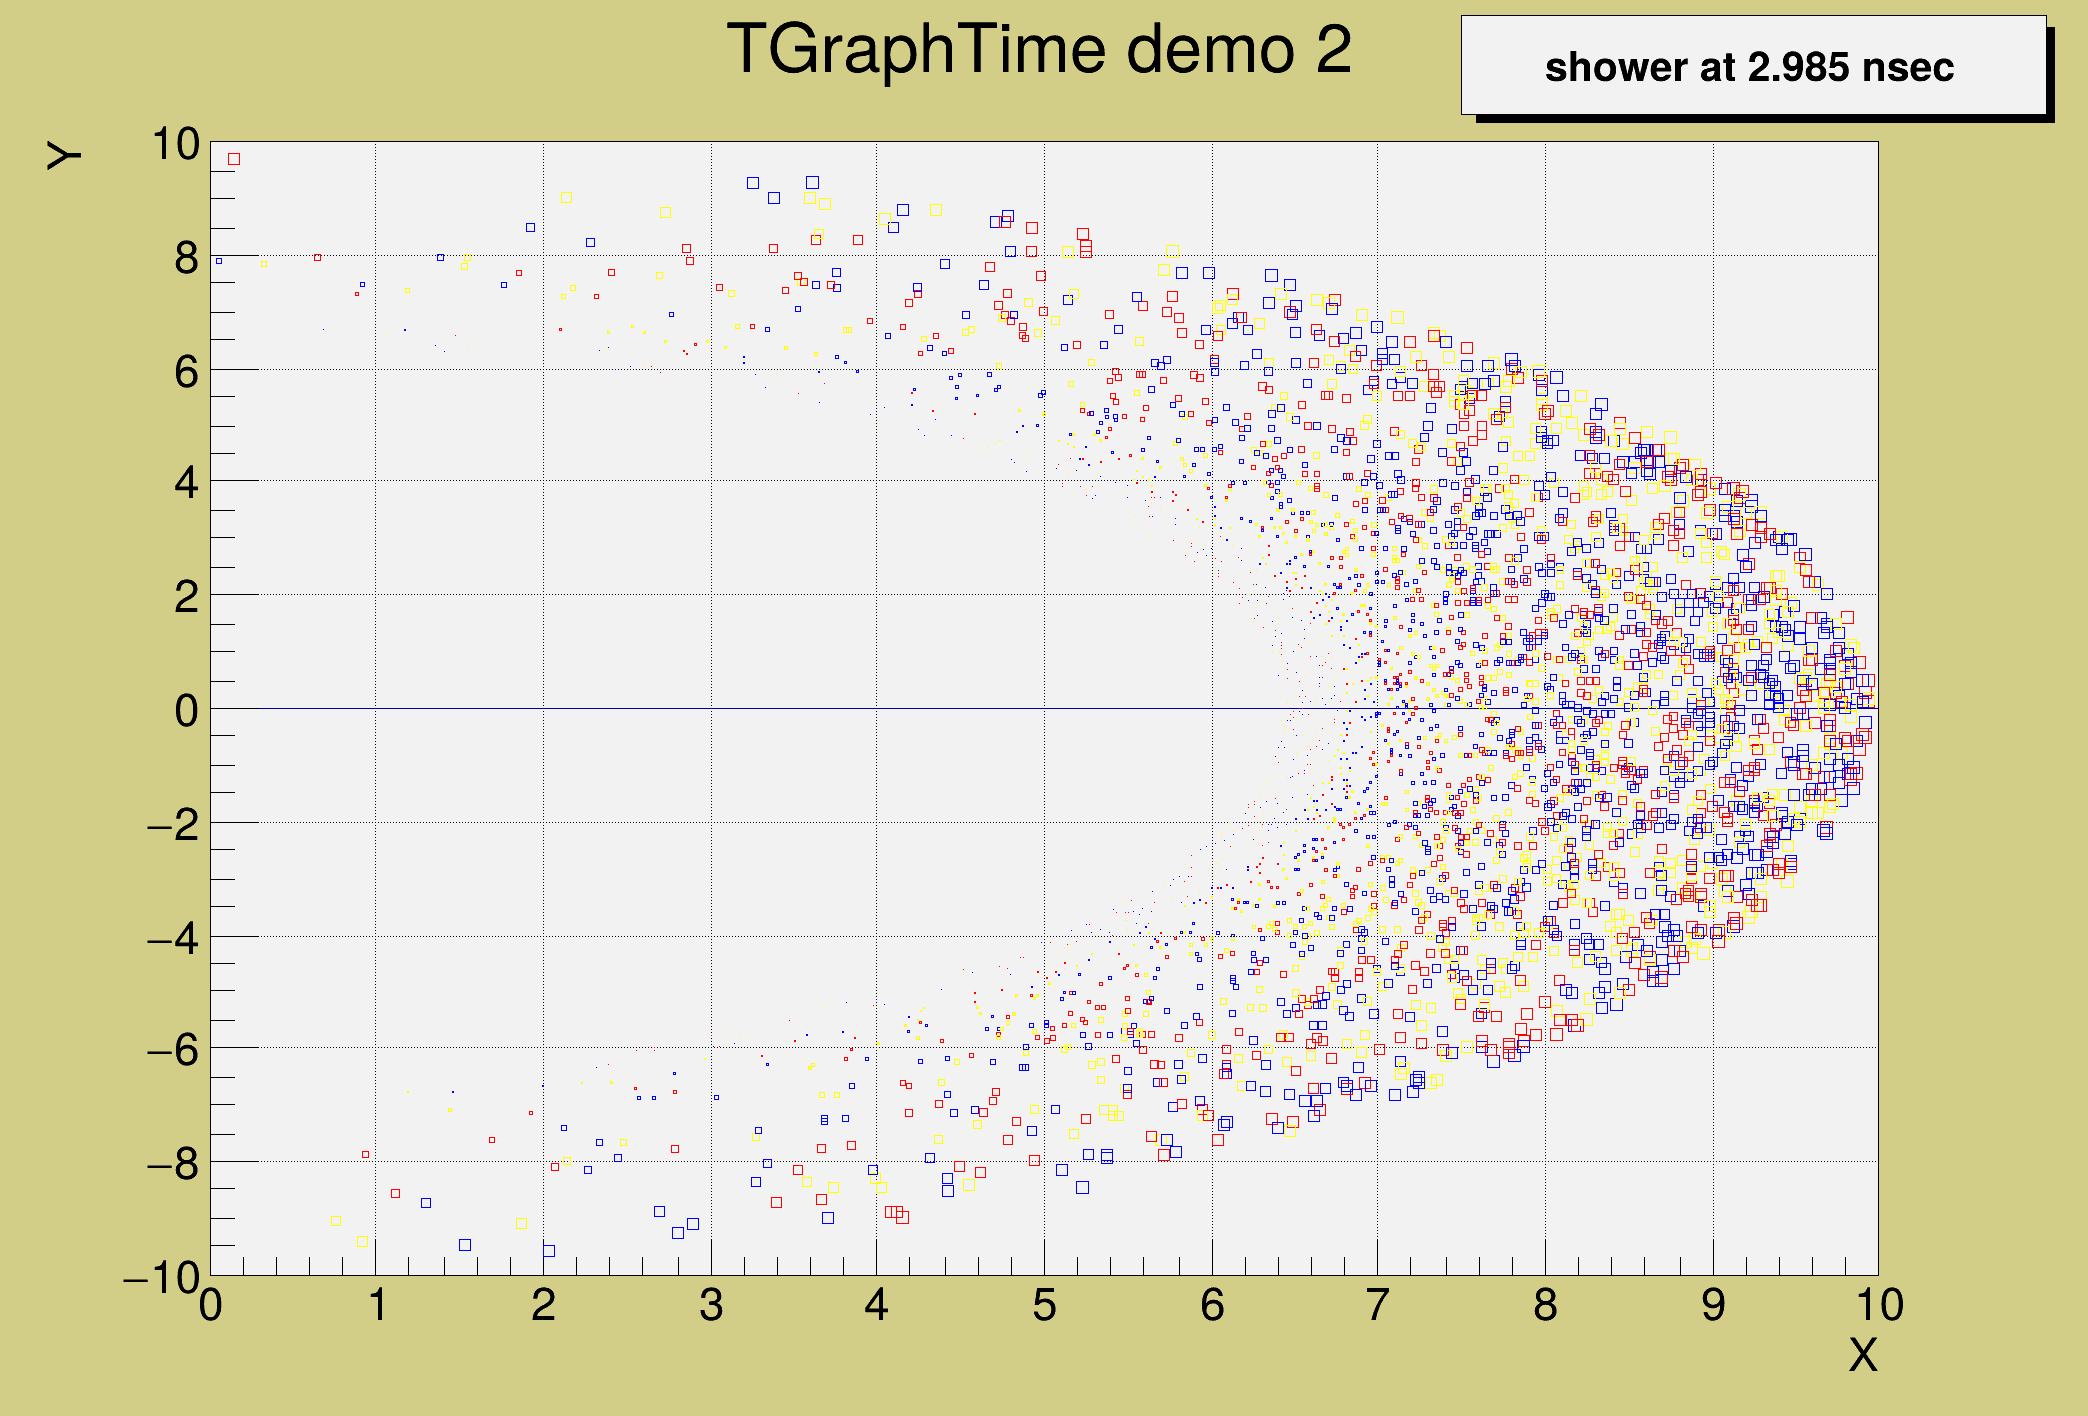 Example of TGraphTime showing how the class could be used to visualize a set of particles with their time stamp in a MonteCarlo program. Example of TGraphTime showing how the class could be used to visualize a set of particles with their time stamp in a MonteCarlo program. | |
| gr101_shade_area.C | |
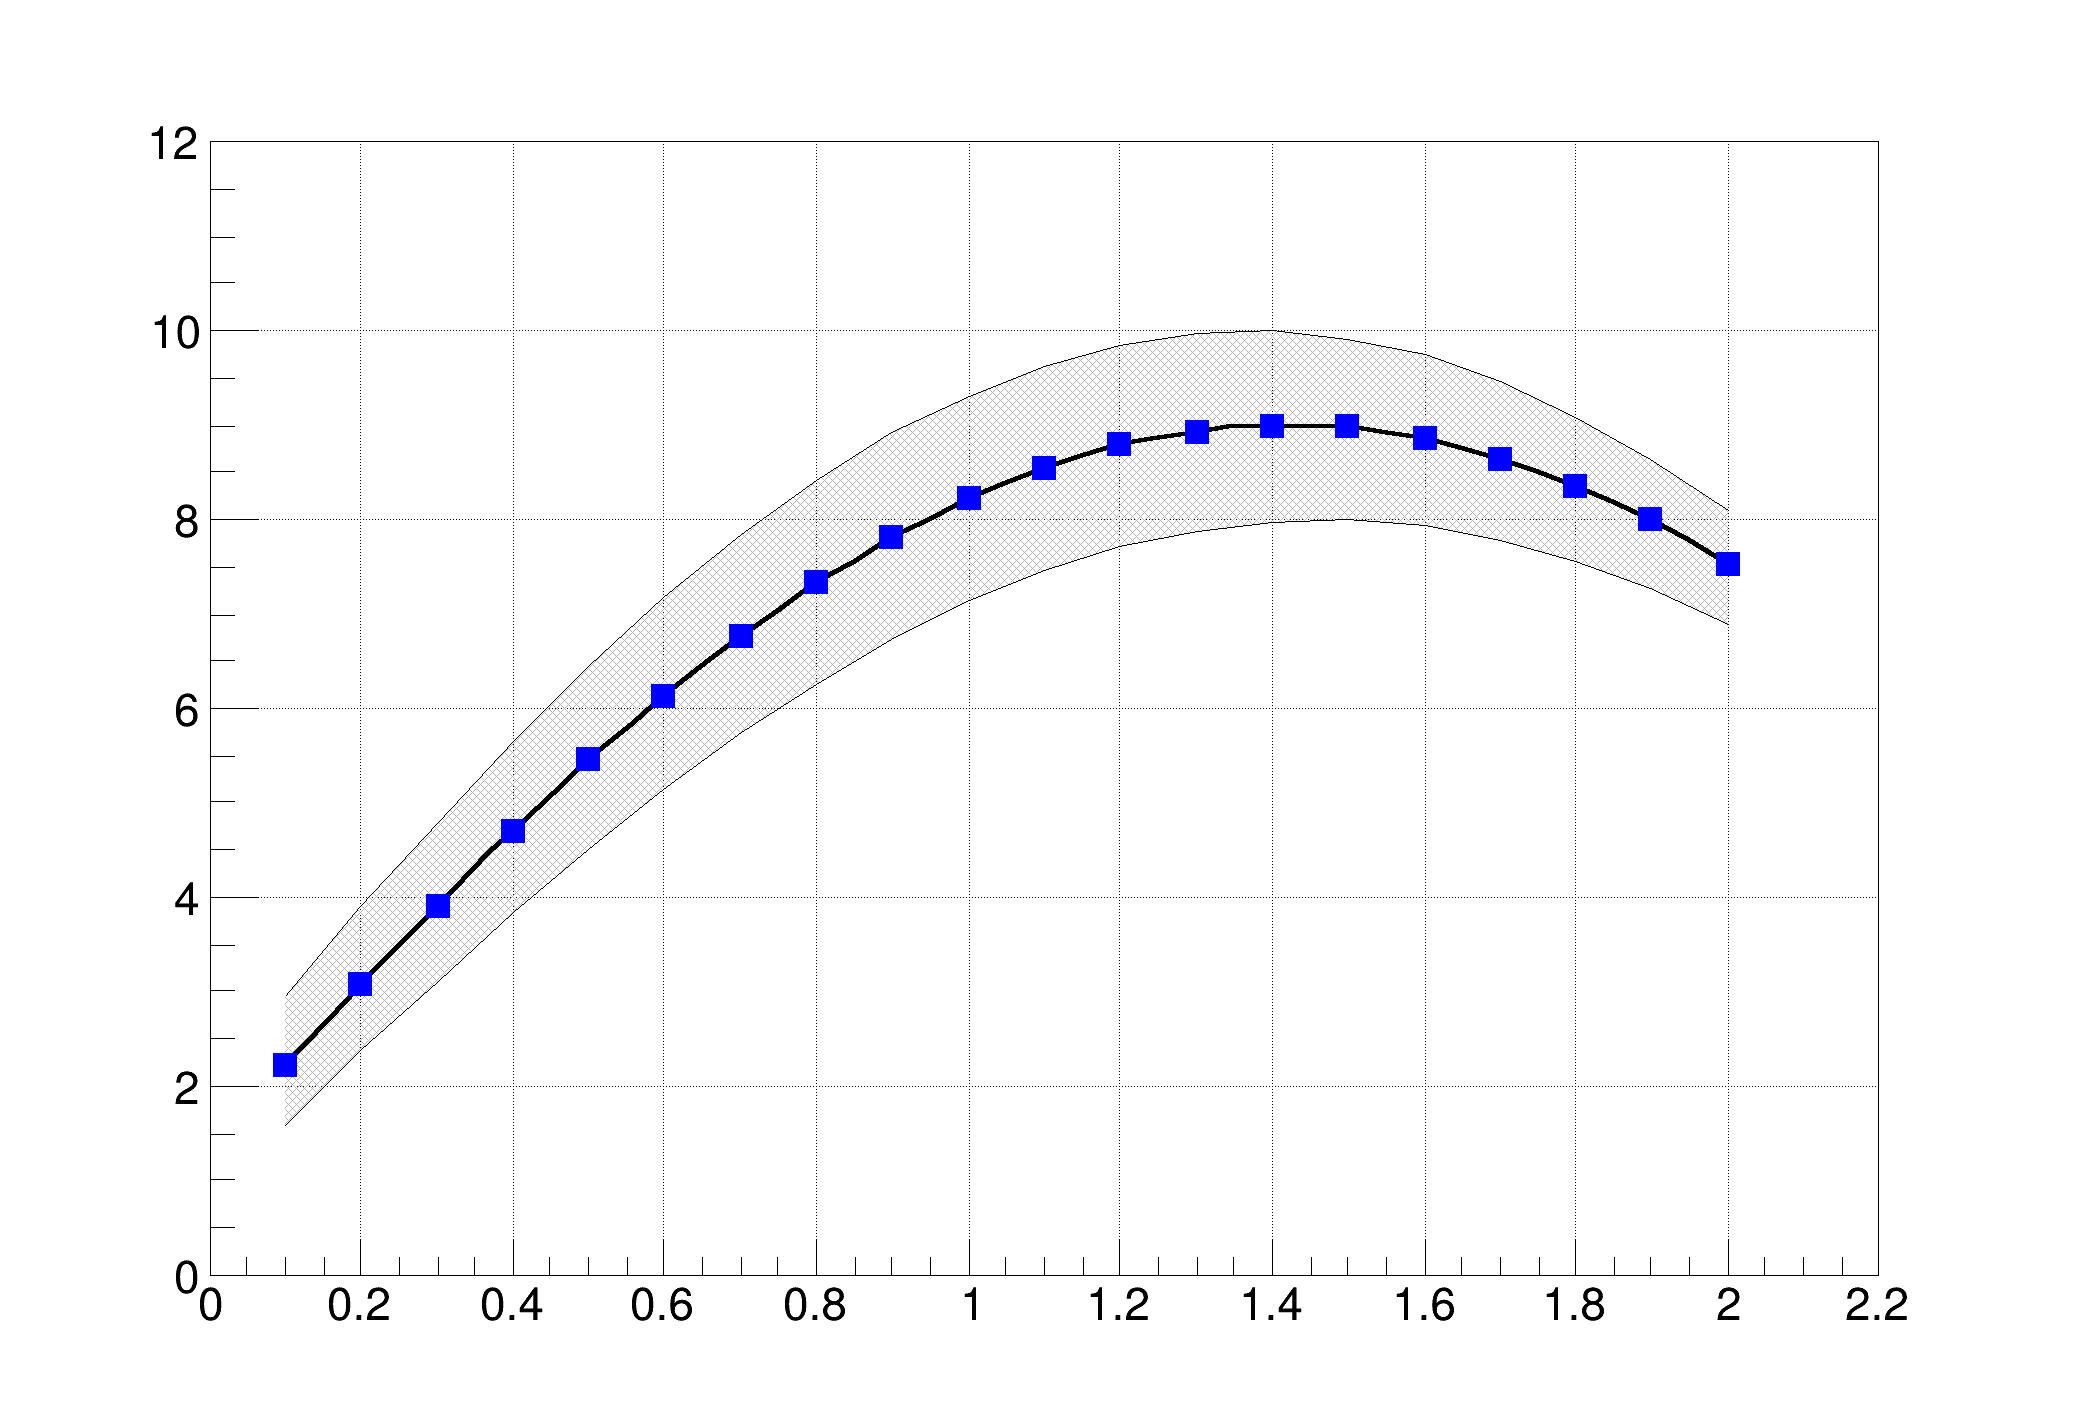 Show how to shade an area between two graphs. Show how to shade an area between two graphs. | |
| gr102_reverse_graph.C | |
 This example tests the reverse graphs obtained with Draw("a pl rx ry ") on a TGraph, where rx and ry refere to the reversing of x and y axis. This example tests the reverse graphs obtained with Draw("a pl rx ry ") on a TGraph, where rx and ry refere to the reversing of x and y axis. | |
| gr103_zones.C | |
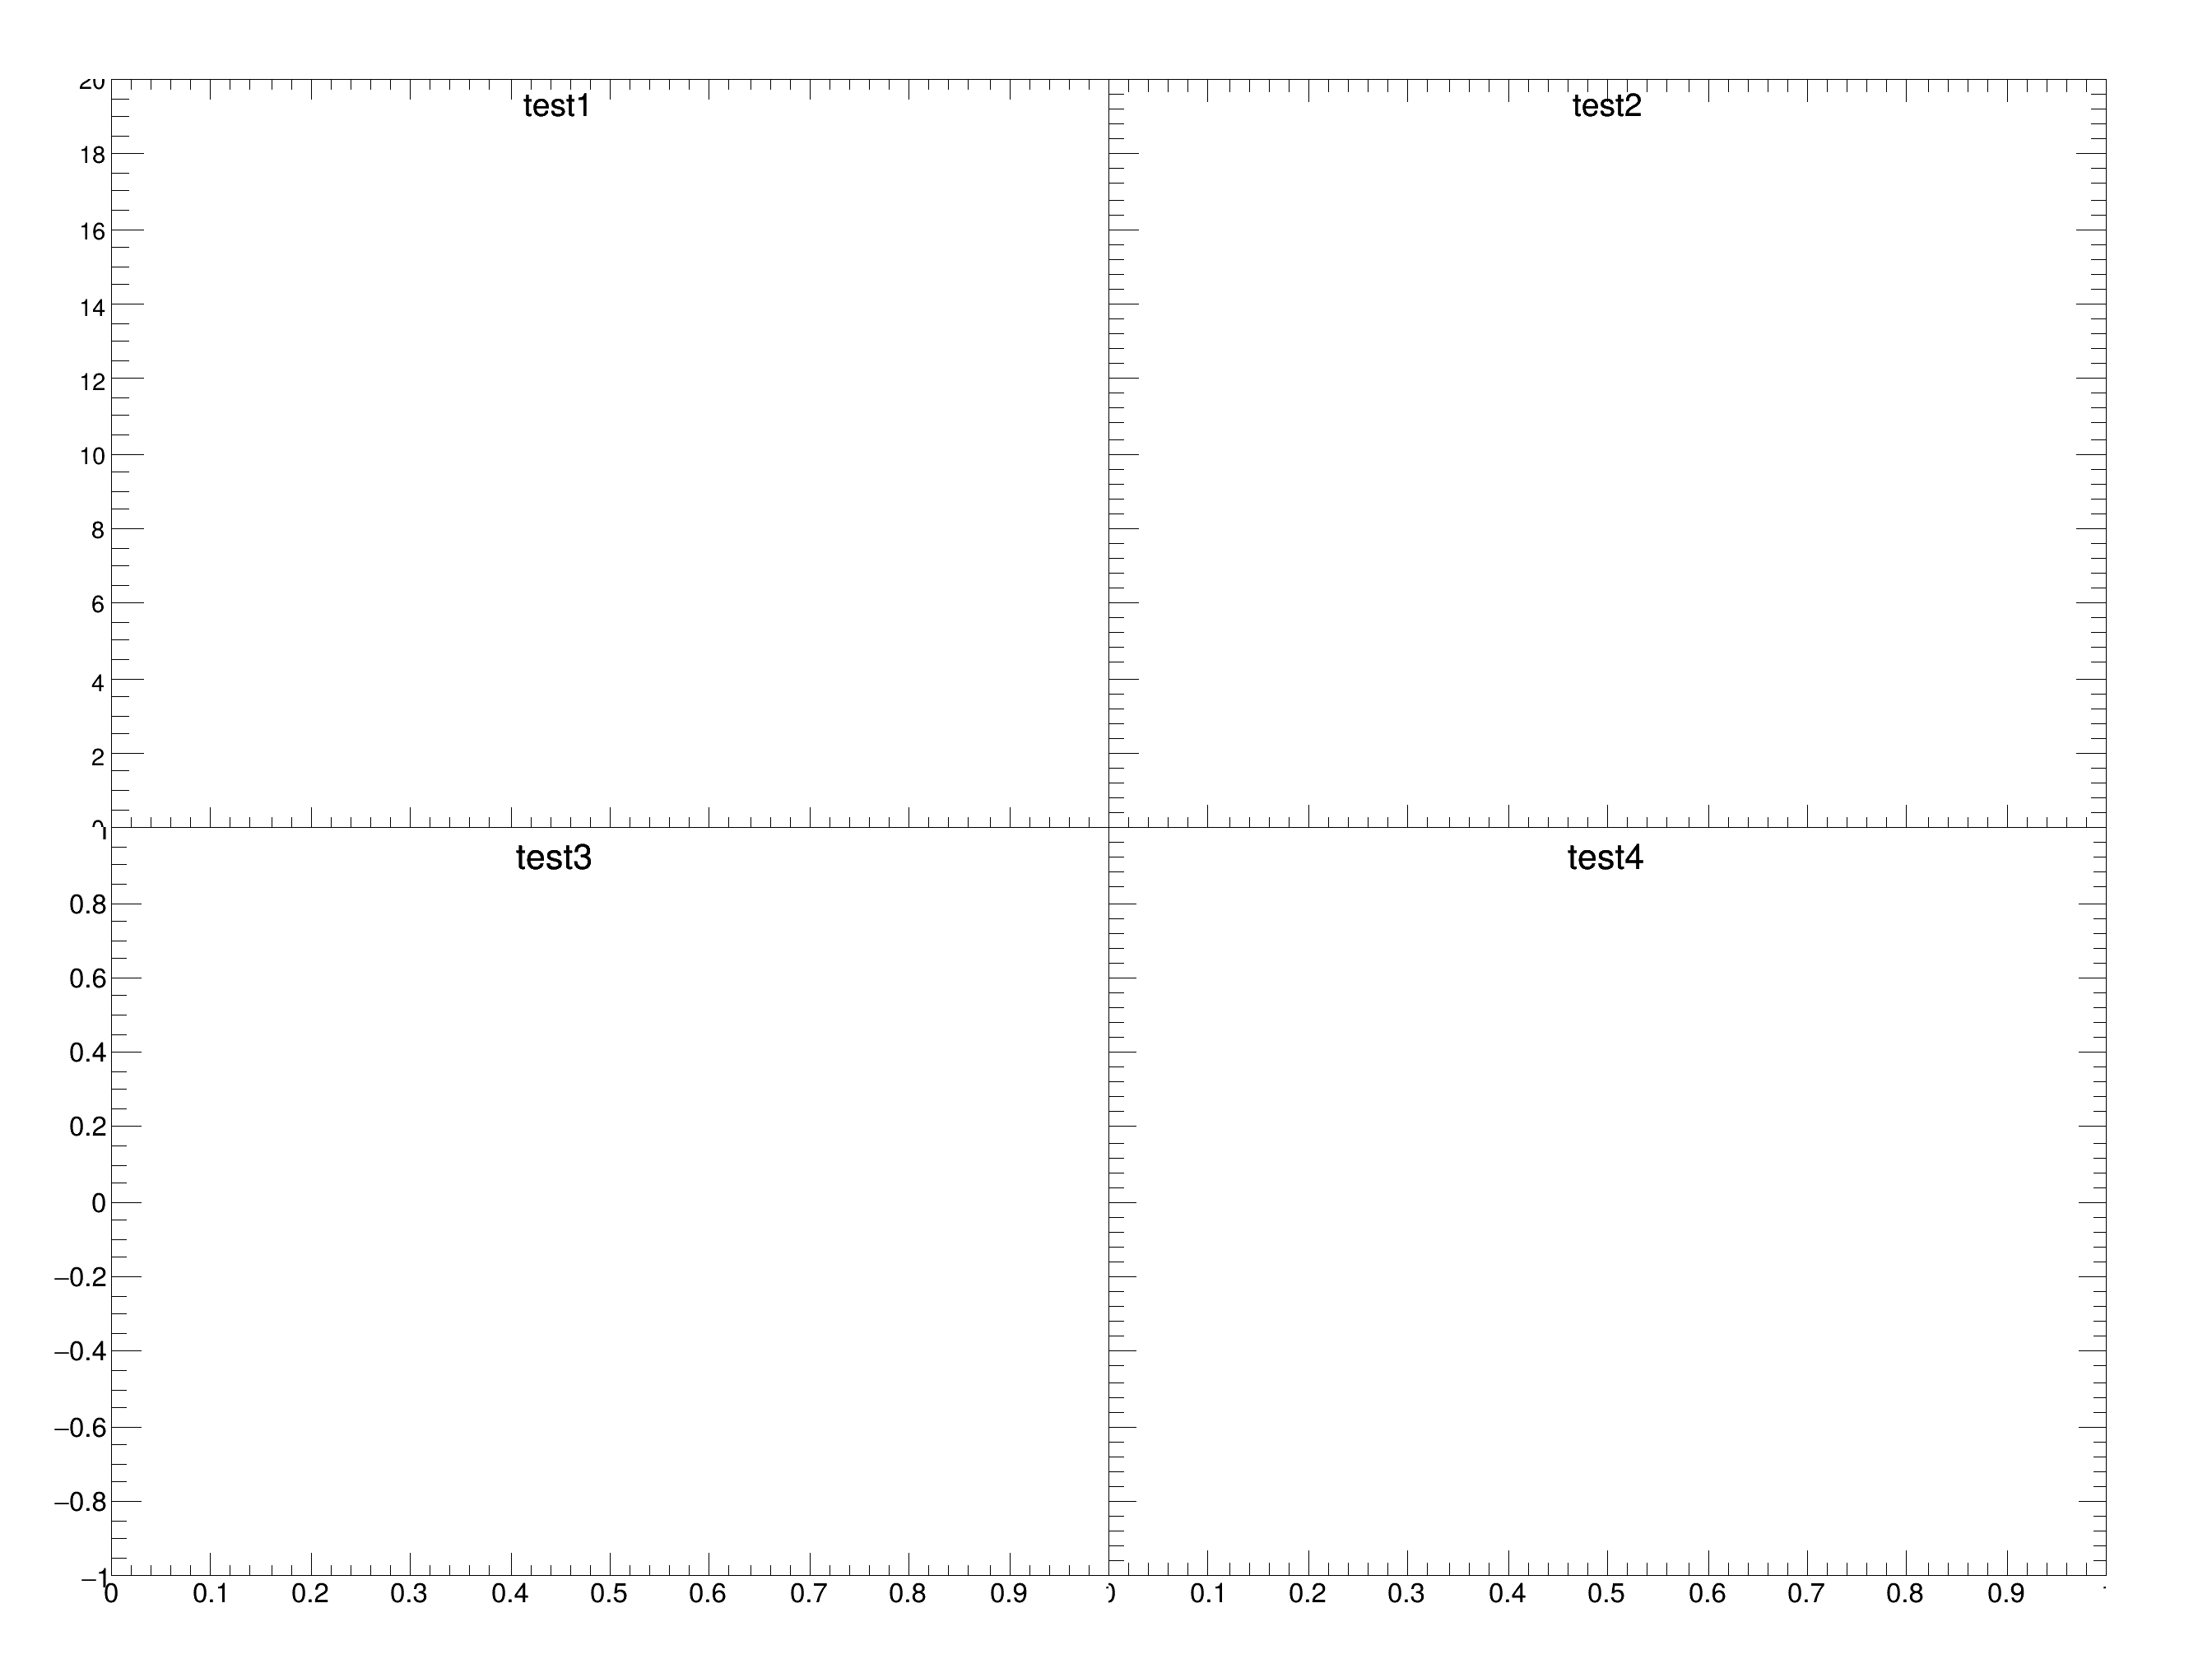 Example of script showing how to divide a canvas into adjacent subpads + axis labels on the top and right side of the pads. Example of script showing how to divide a canvas into adjacent subpads + axis labels on the top and right side of the pads. | |
| gr103_zones.py | |
| Example of script showing how to divide a canvas into adjacent subpads + axis labels on the top and right side of the pads. | |
| gr104_palettecolor.C | |
 Palette coloring for graphs is activated thanks to the options PFC (Palette Fill Color), PLC (Palette Line Color) and AMC (Palette Marker Color). Palette coloring for graphs is activated thanks to the options PFC (Palette Fill Color), PLC (Palette Line Color) and AMC (Palette Marker Color). | |
| gr105_multigraphpalettecolor.C | |
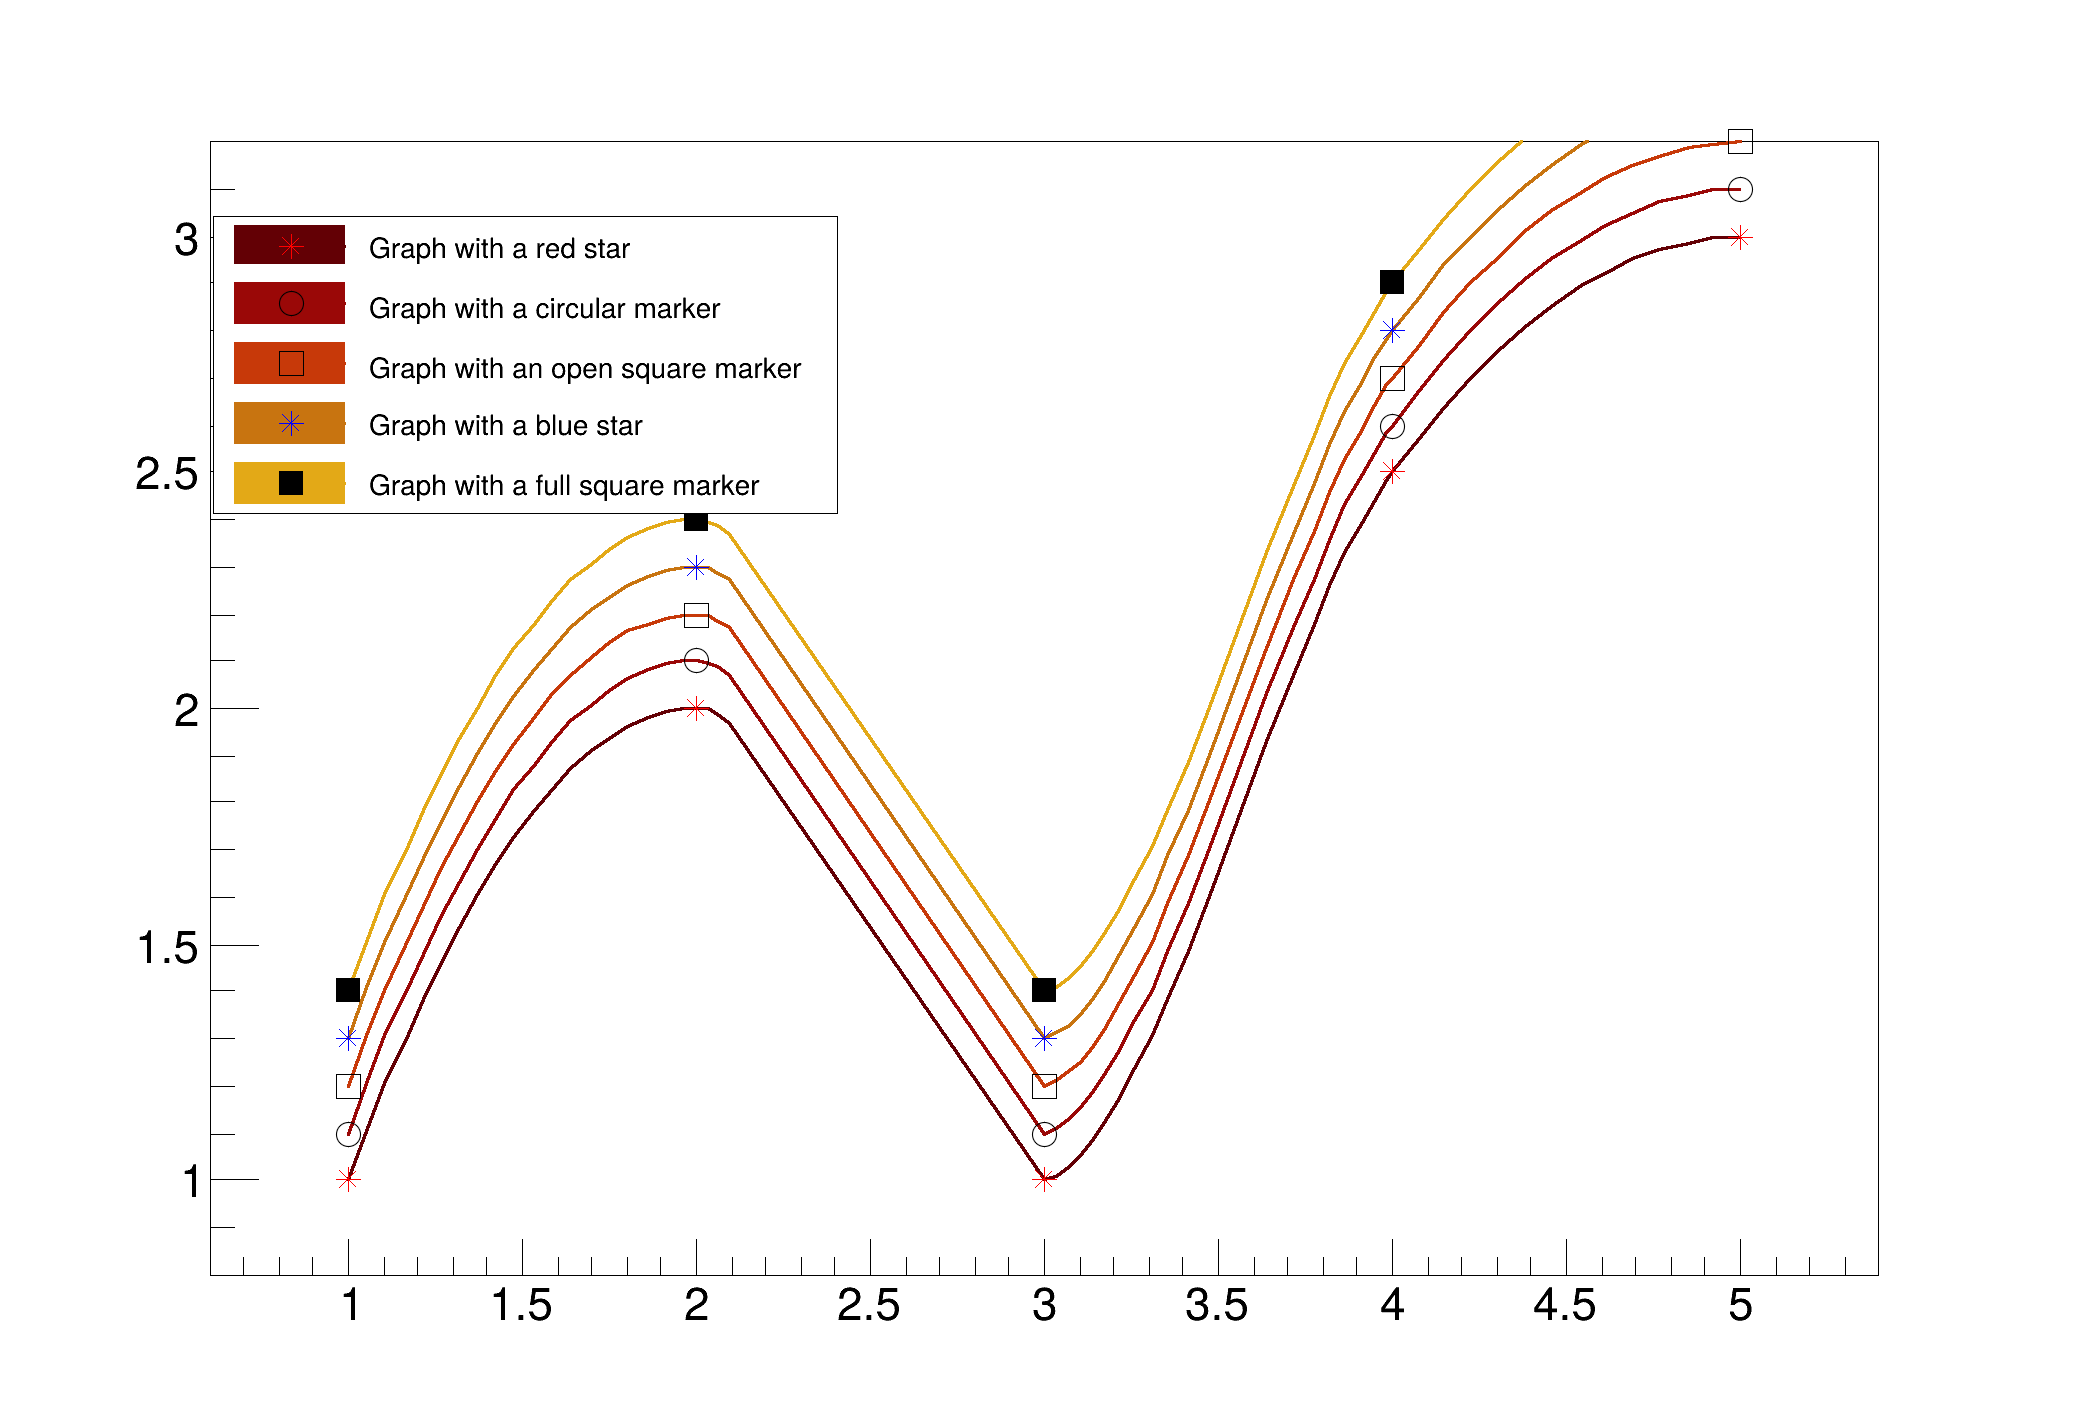
 Palette coloring for multi-graphs is activated thanks to the options PFC (Palette Fill Color), PLC (Palette Line Color) and AMC (Palette Marker Color). Palette coloring for multi-graphs is activated thanks to the options PFC (Palette Fill Color), PLC (Palette Line Color) and AMC (Palette Marker Color). | |
| gr106_exclusiongraph.C | |
 Draw three graphs with an exclusion zone. Draw three graphs with an exclusion zone. | |
| gr107_exclusiongraph2.C | |
 Draw several graphs with exclusion zones. Draw several graphs with exclusion zones. | |
| gr108_timeSeriesFromCSV.C | |
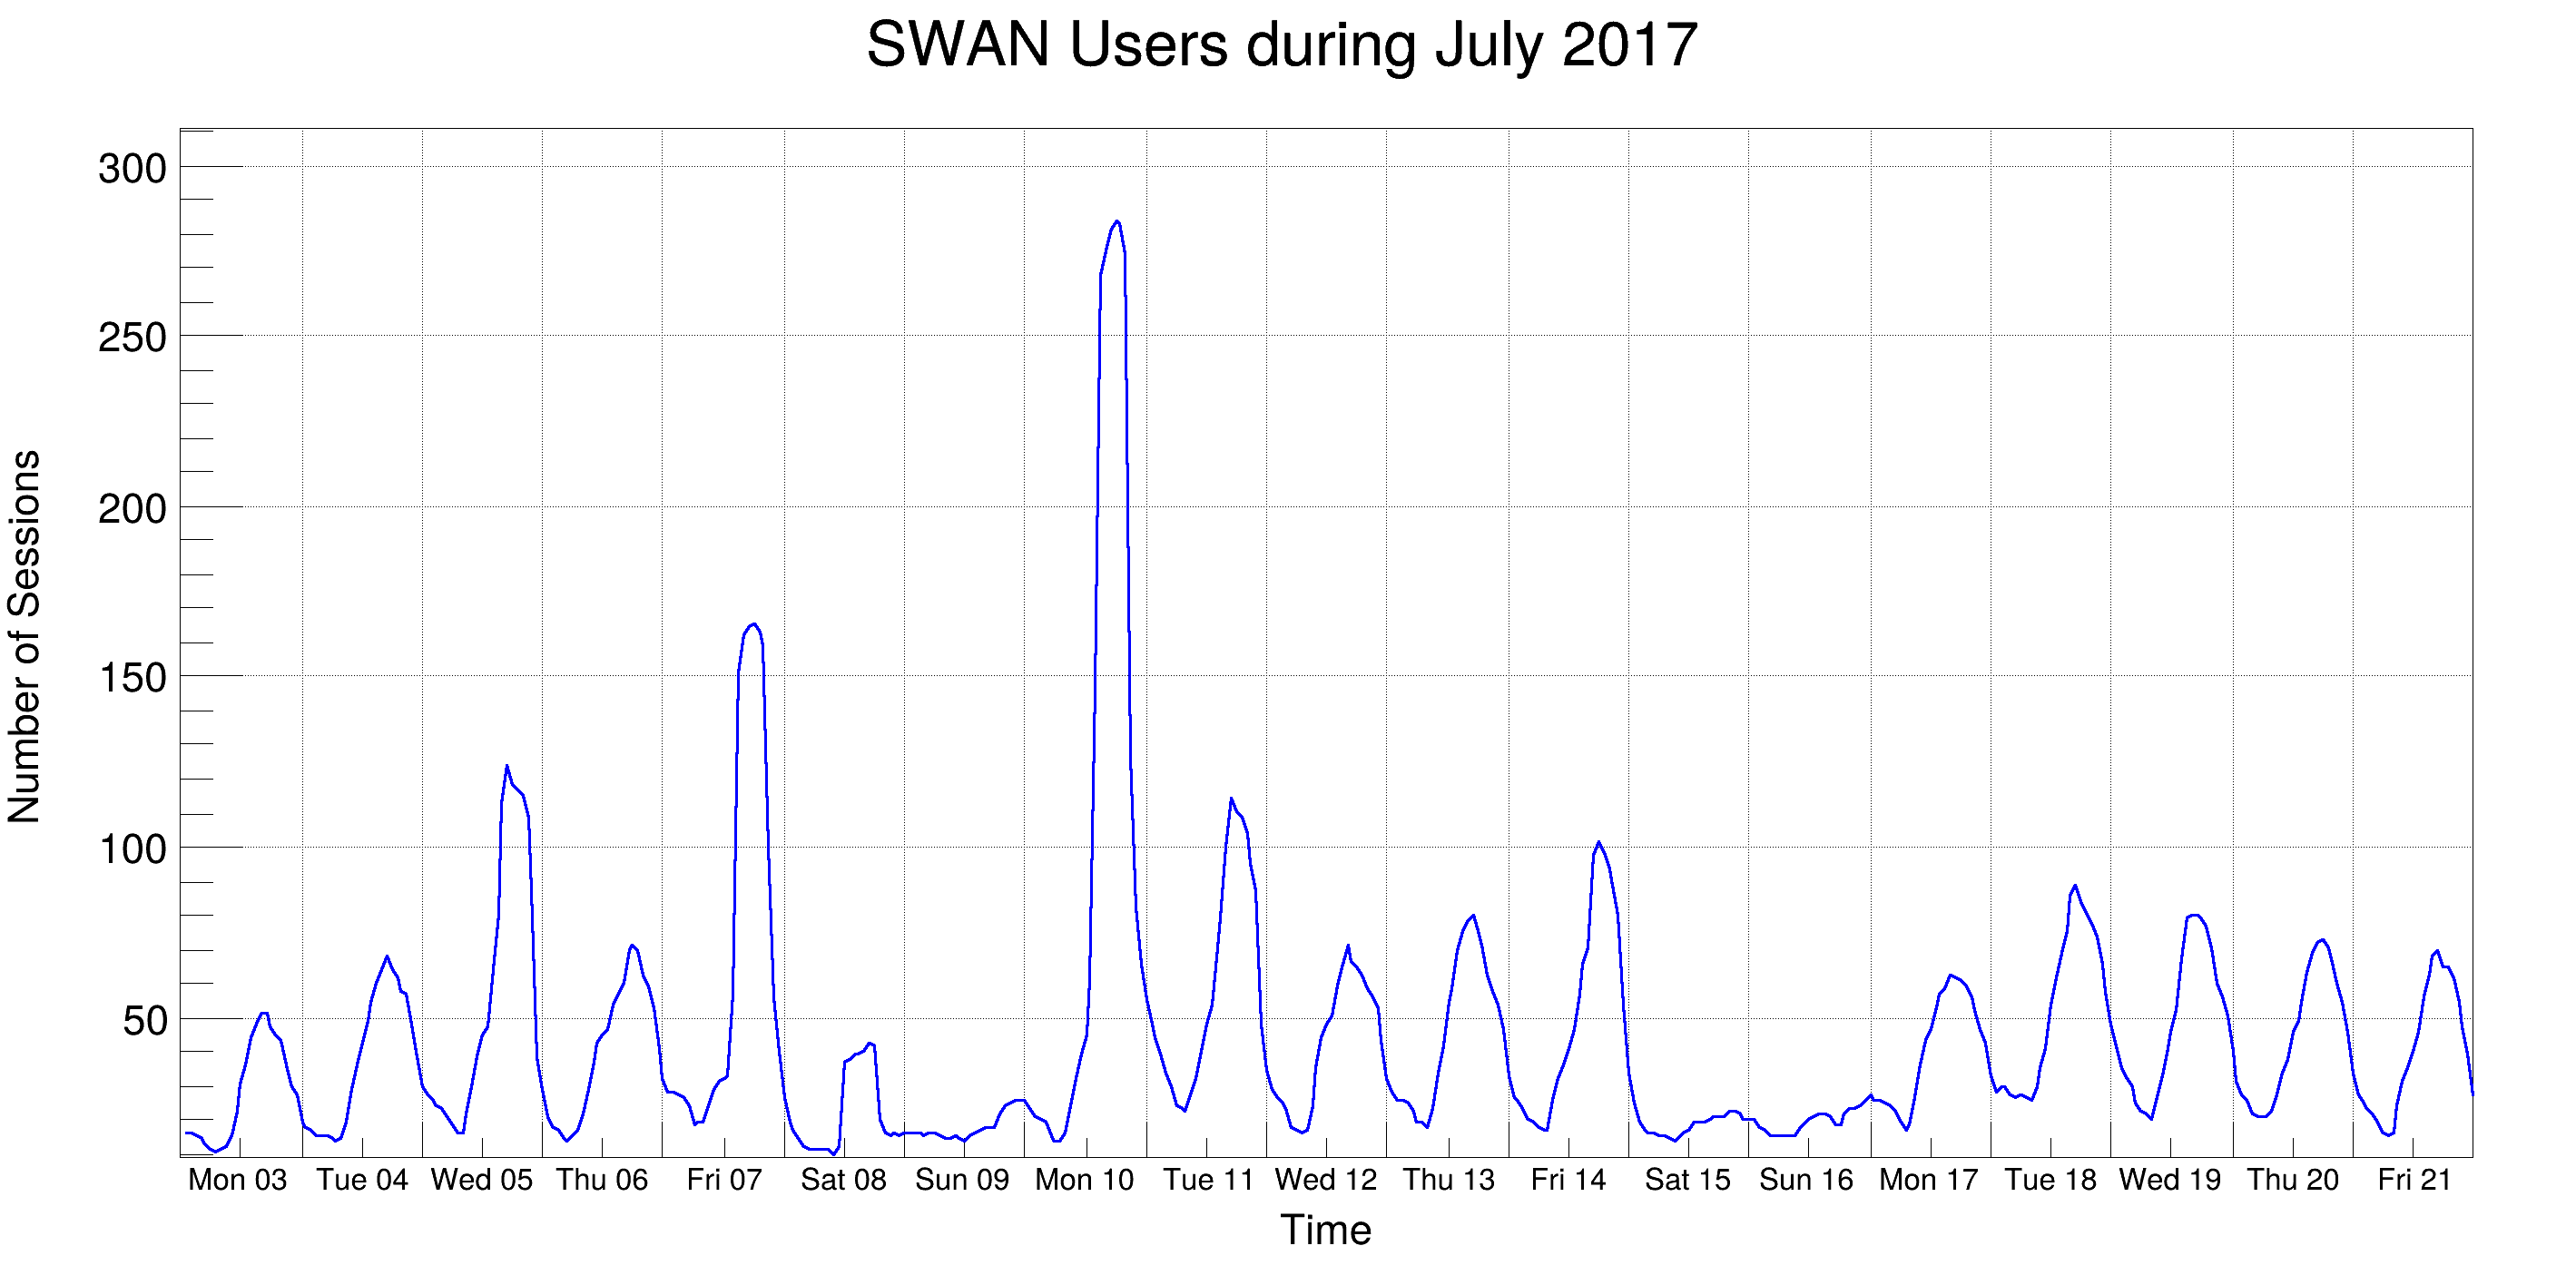 This macro illustrates the use of the time axis on a TGraph with data read from a text file containing the SWAN usage statistics during July 2017. This macro illustrates the use of the time axis on a TGraph with data read from a text file containing the SWAN usage statistics during July 2017. | |
| gr108_timeSeriesFromCSV.py | |
| This macro illustrates the use of the time axis on a TGraph with data read from a text file containing the SWAN usage statistics during July 2017. | |
| gr109_timeSeriesFromCSV_RDF.C | |
 This macro illustrates the use of the time axis on a TGraph with data read from a text file containing the SWAN usage statistics during July 2017. This macro illustrates the use of the time axis on a TGraph with data read from a text file containing the SWAN usage statistics during July 2017. | |
| gr110_logscale.C | |
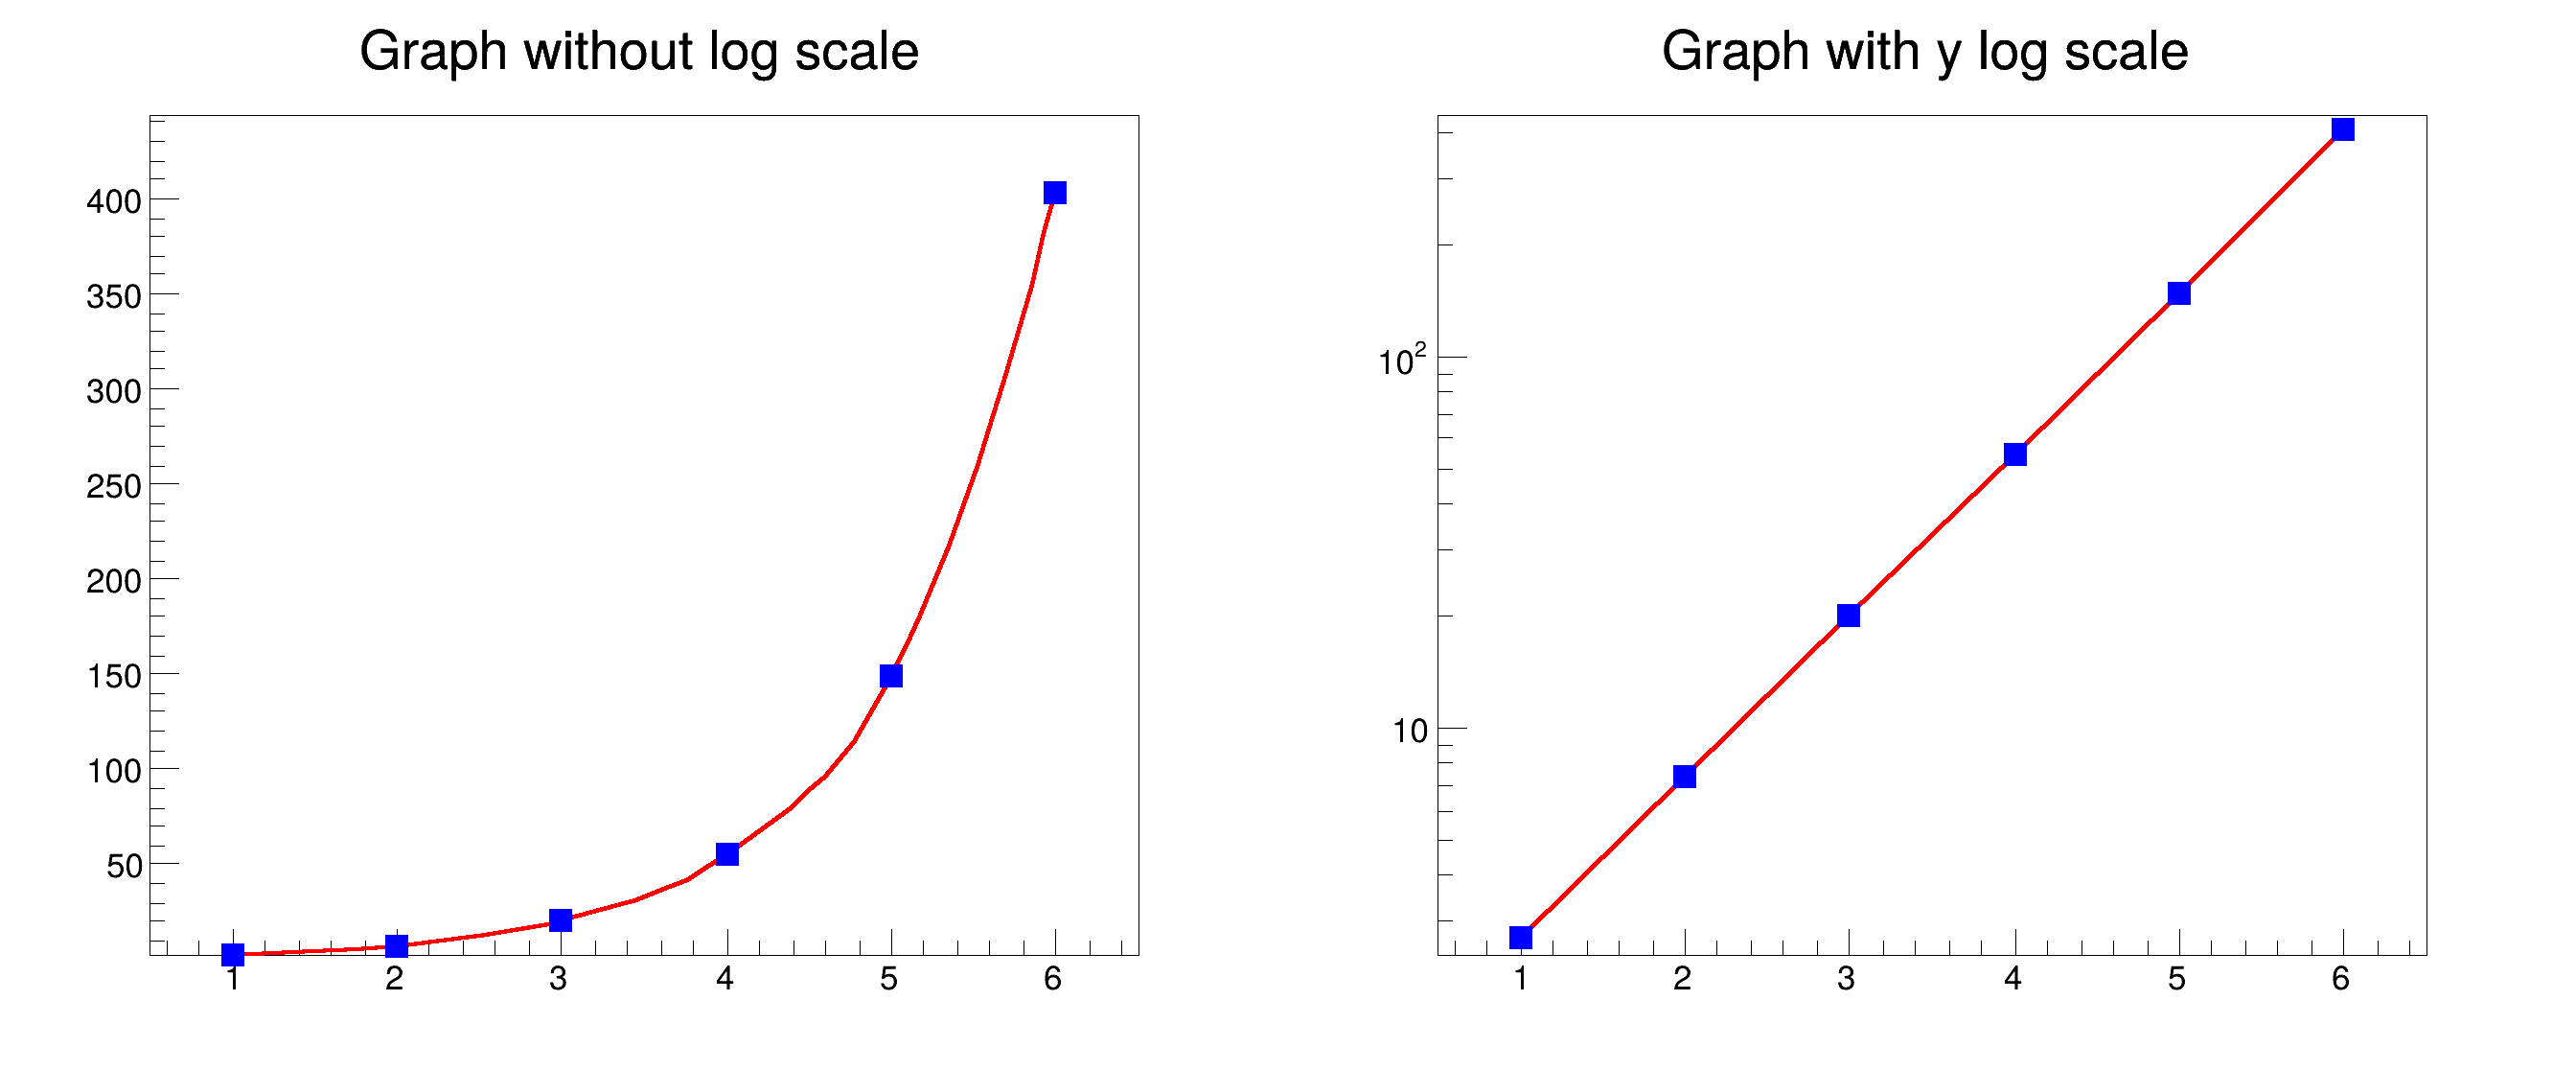 This tutorial demonstrates how to set a logarithmic scale for the axes of a graph using the This tutorial demonstrates how to set a logarithmic scale for the axes of a graph using the SetLogScale() method. | |
| gr111_legend.C | |
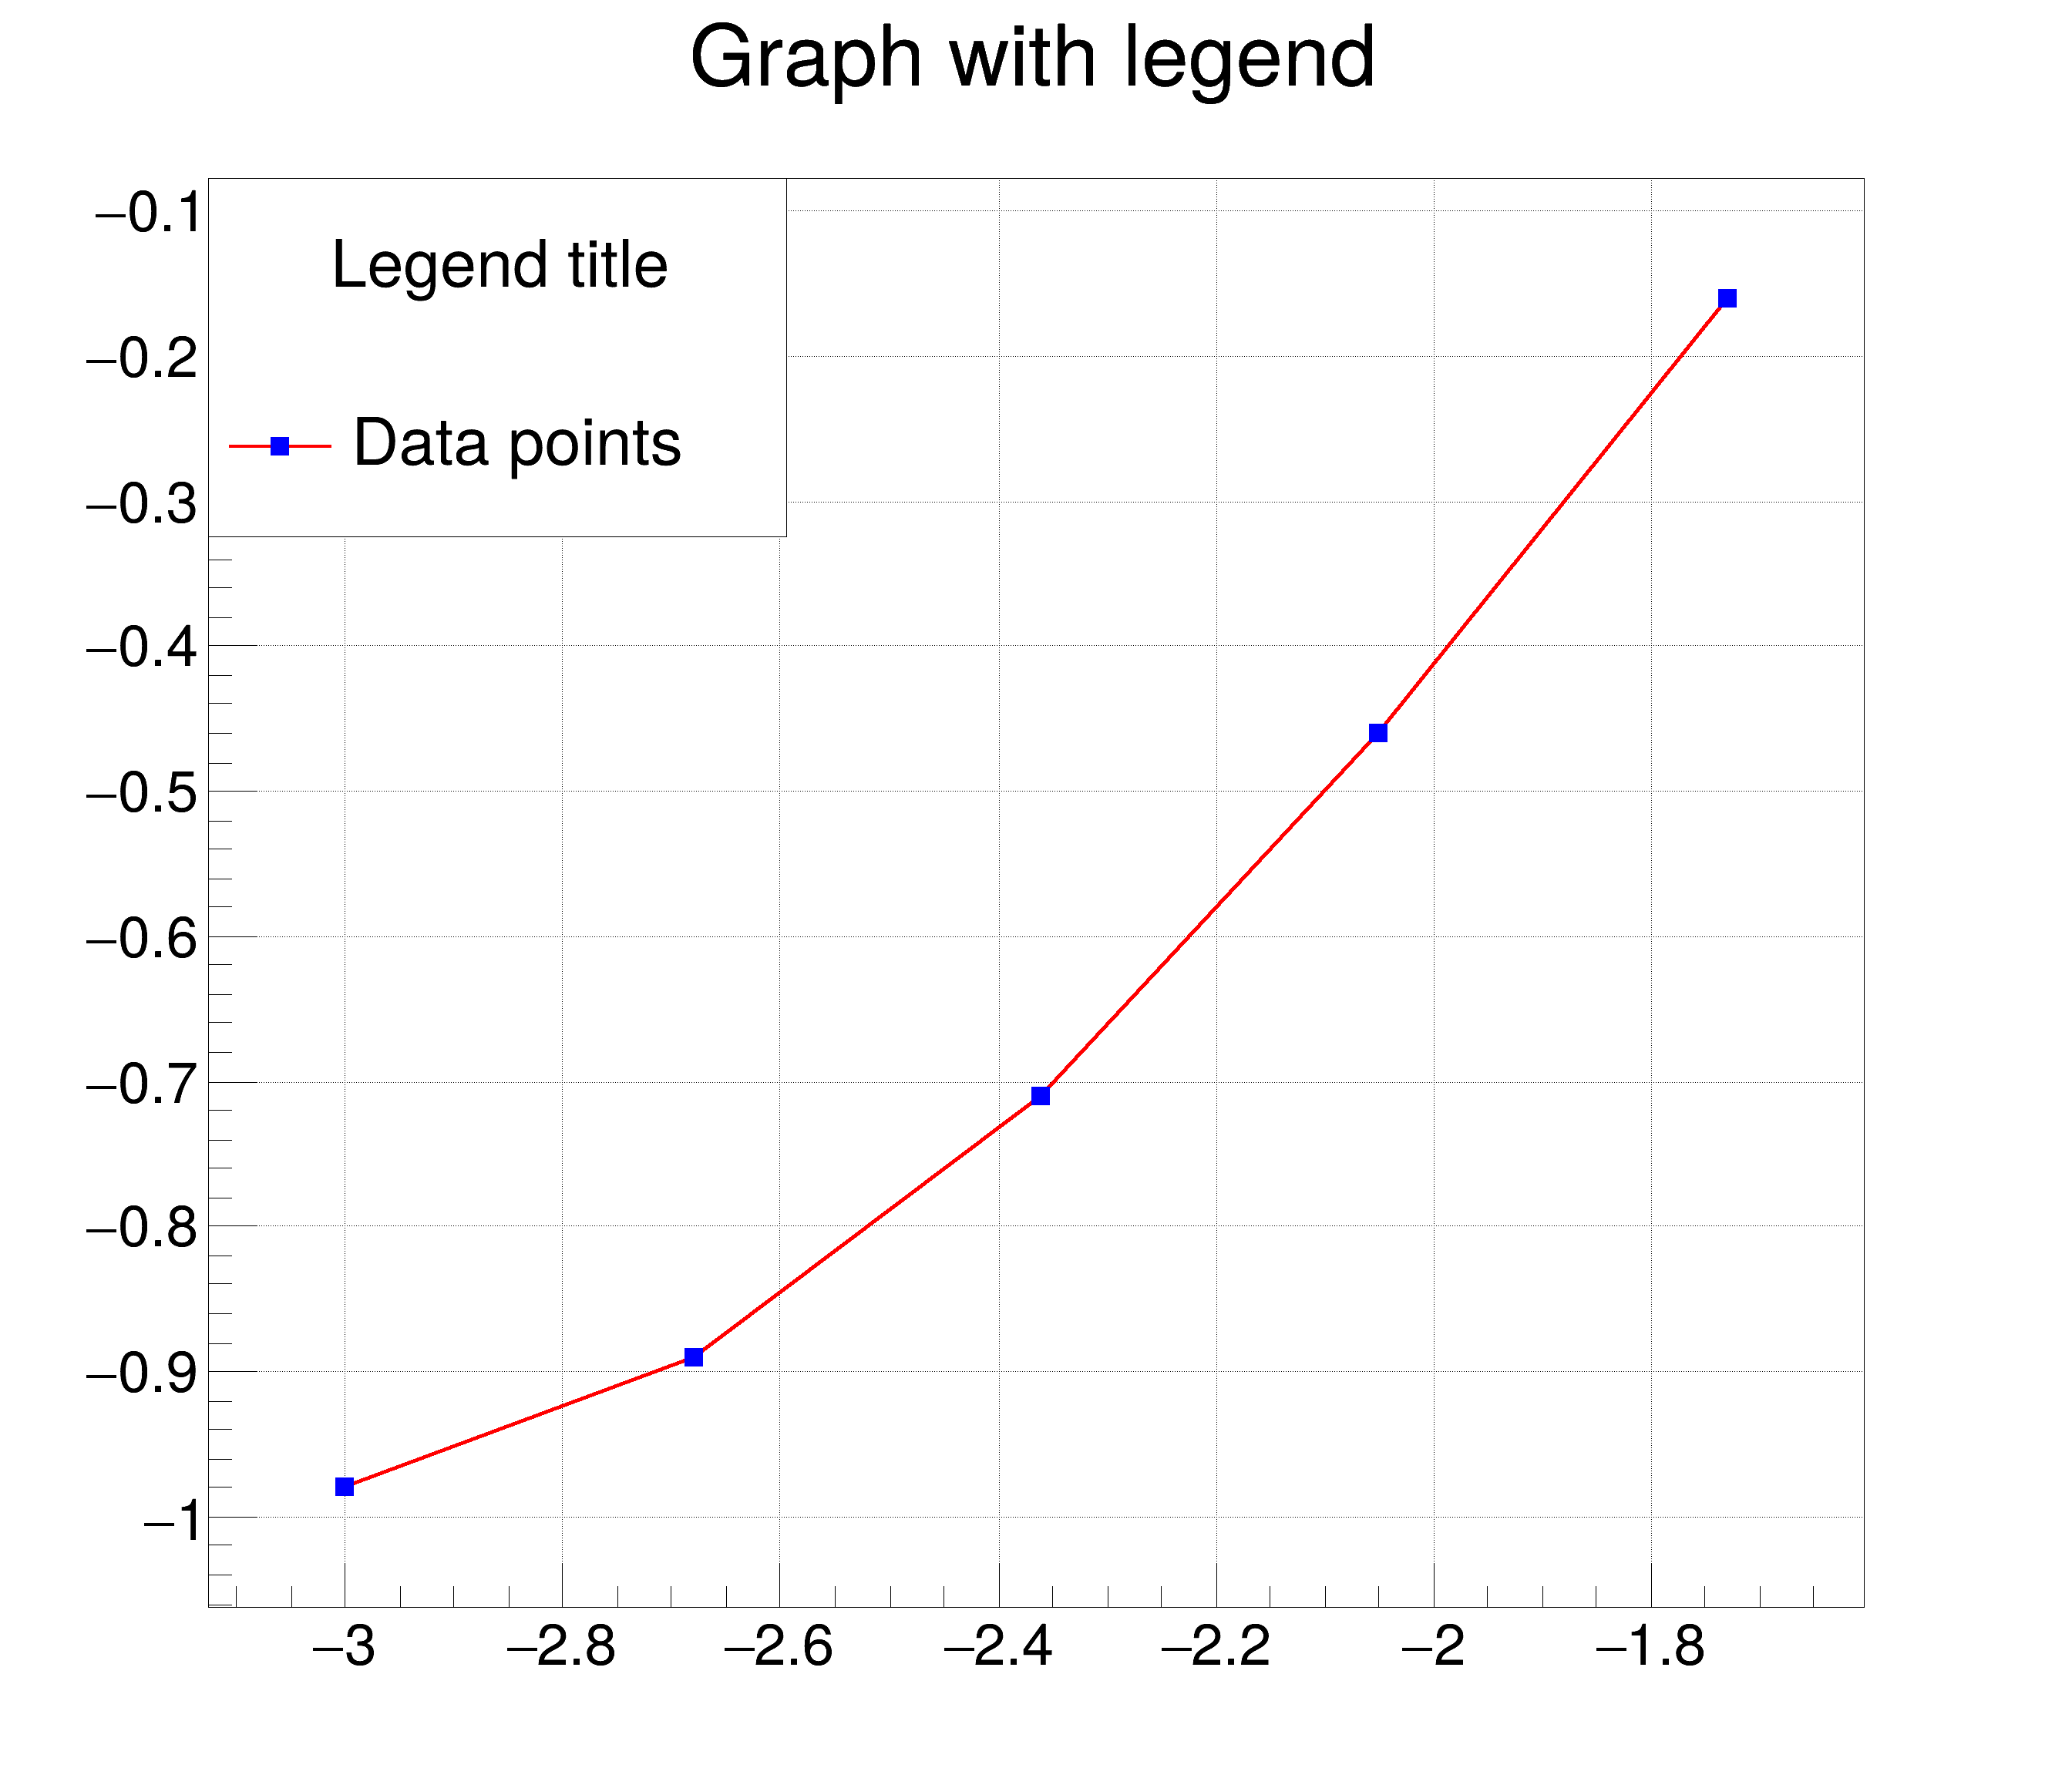 Simple graph with legend. Simple graph with legend. | |
| gr112_reverse_graph_and_errors.C | |
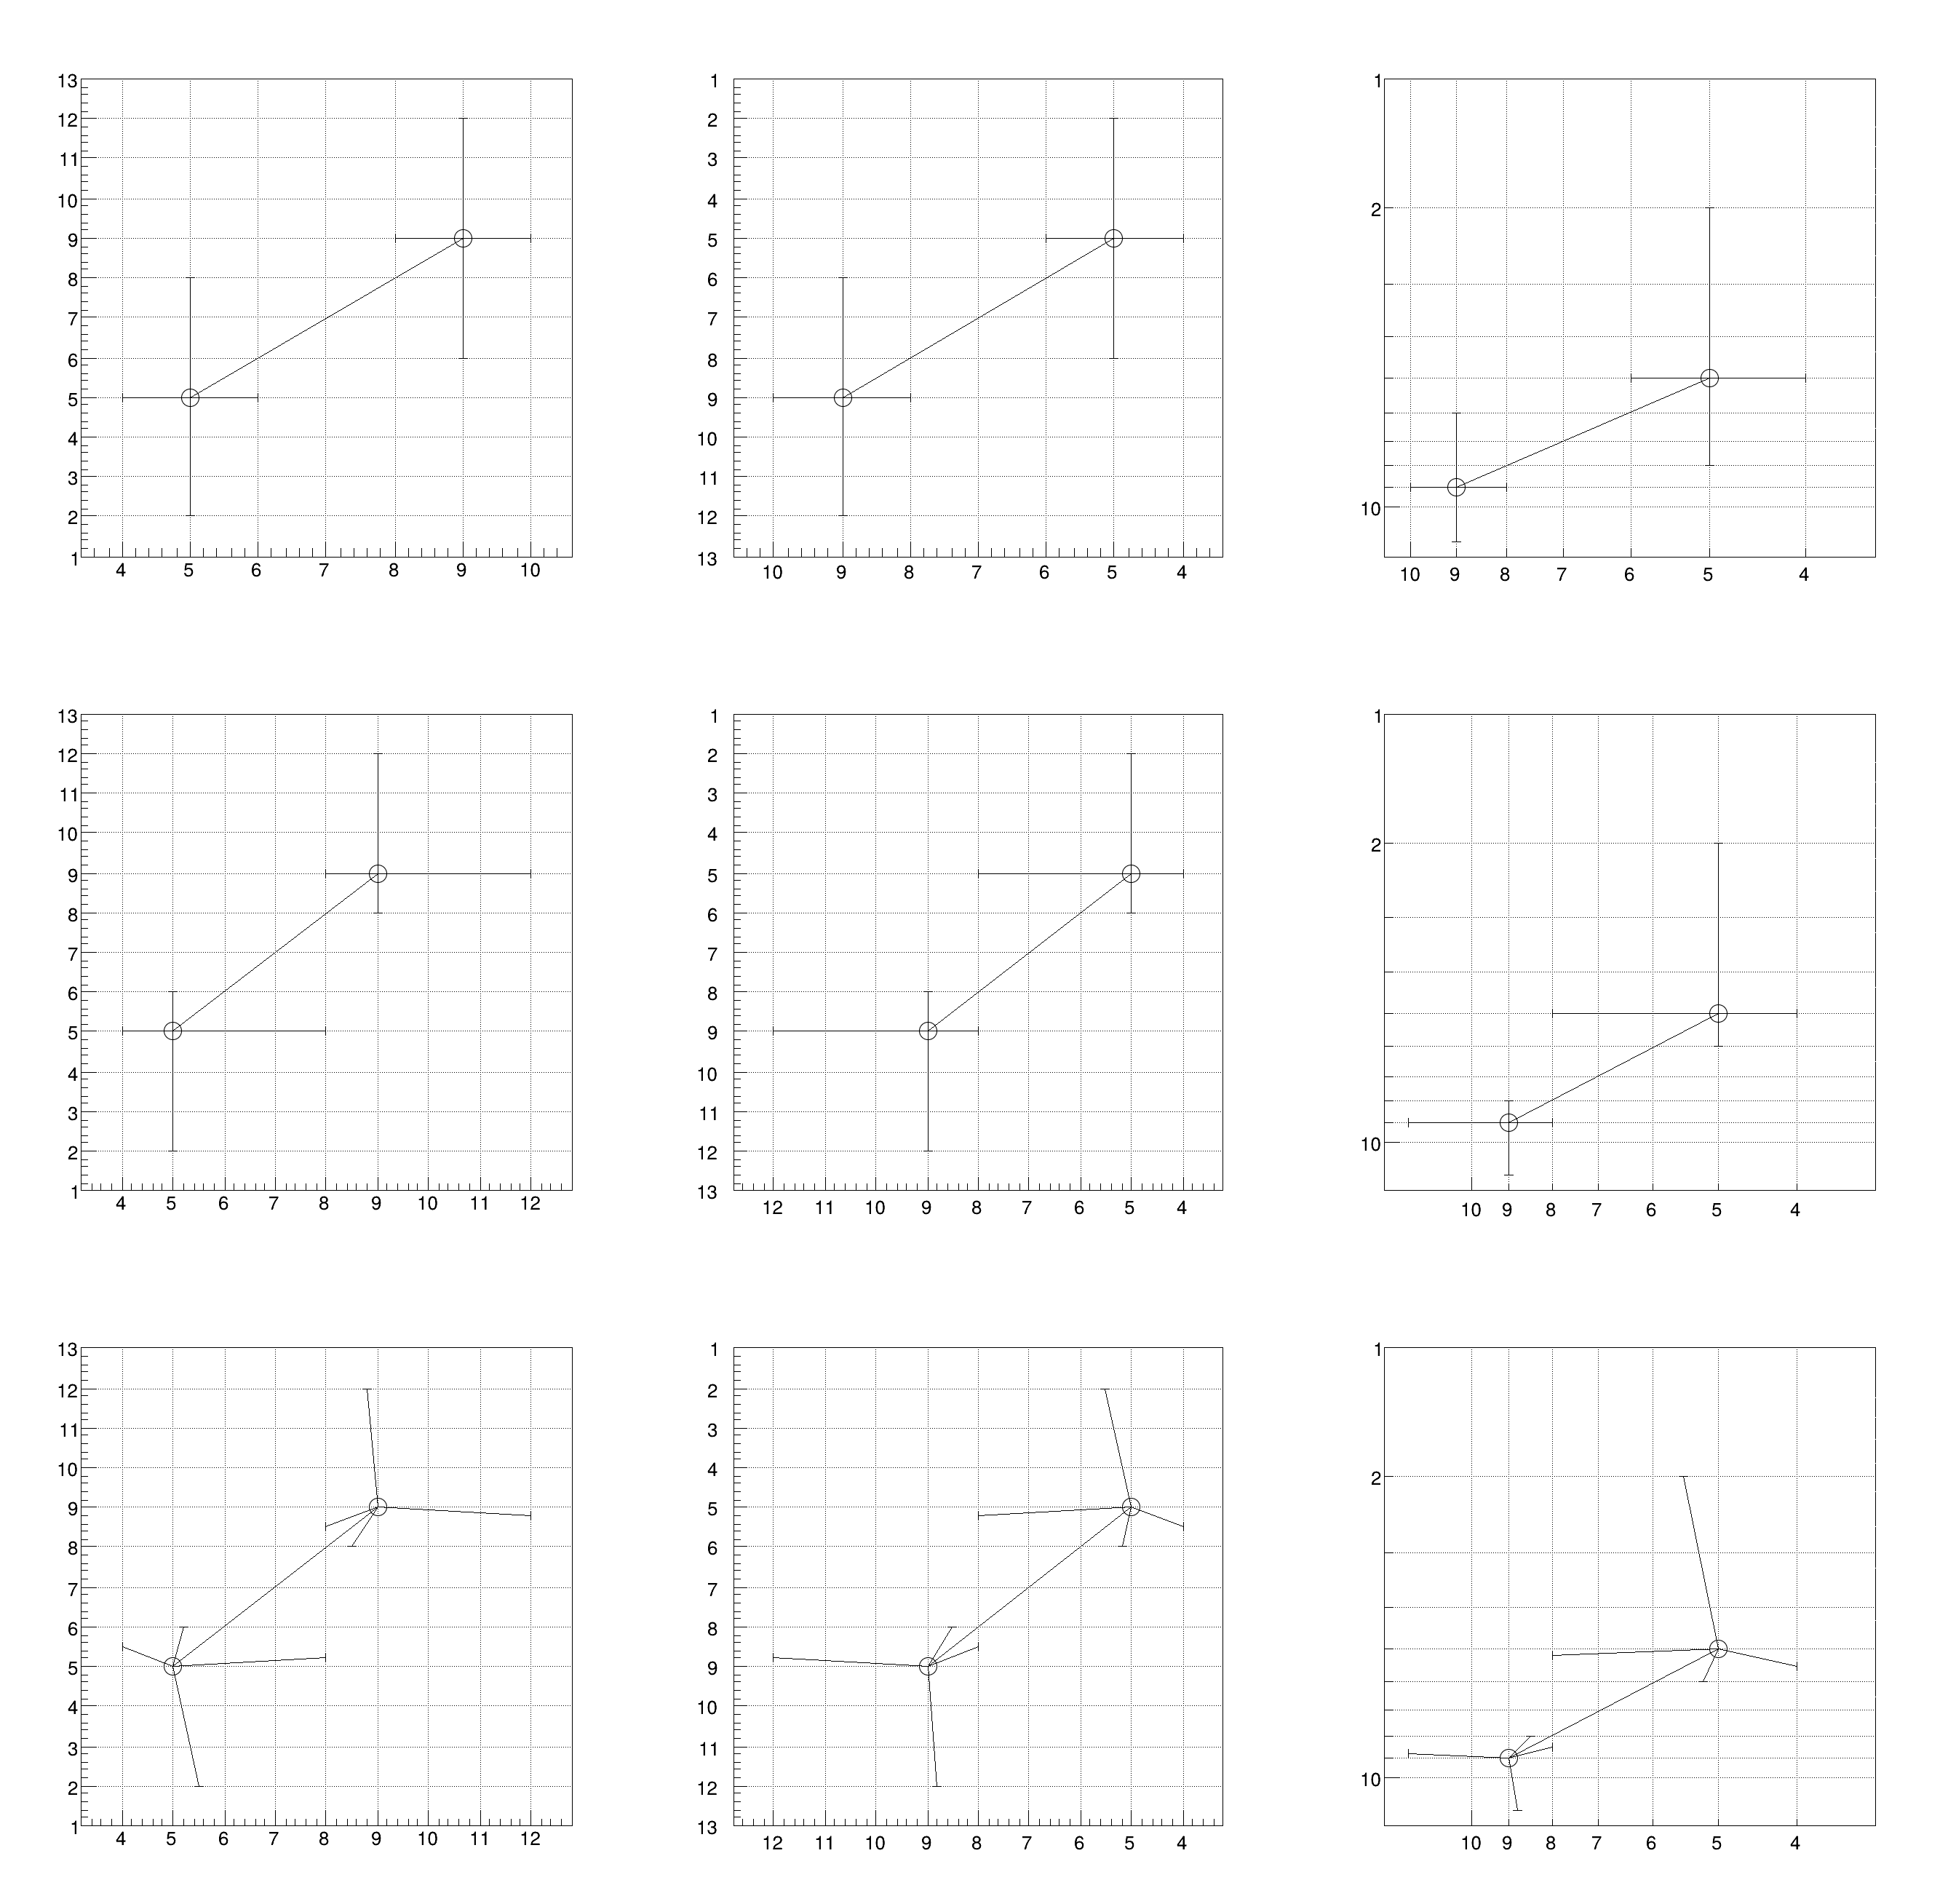 This example tests all the various cases of reverse graphs obtained with Draw("a pl rx ry "), where rx and ry refer to the reversing of x and y axis. This example tests all the various cases of reverse graphs obtained with Draw("a pl rx ry "), where rx and ry refer to the reversing of x and y axis. | |
| gr201_waves.C | |
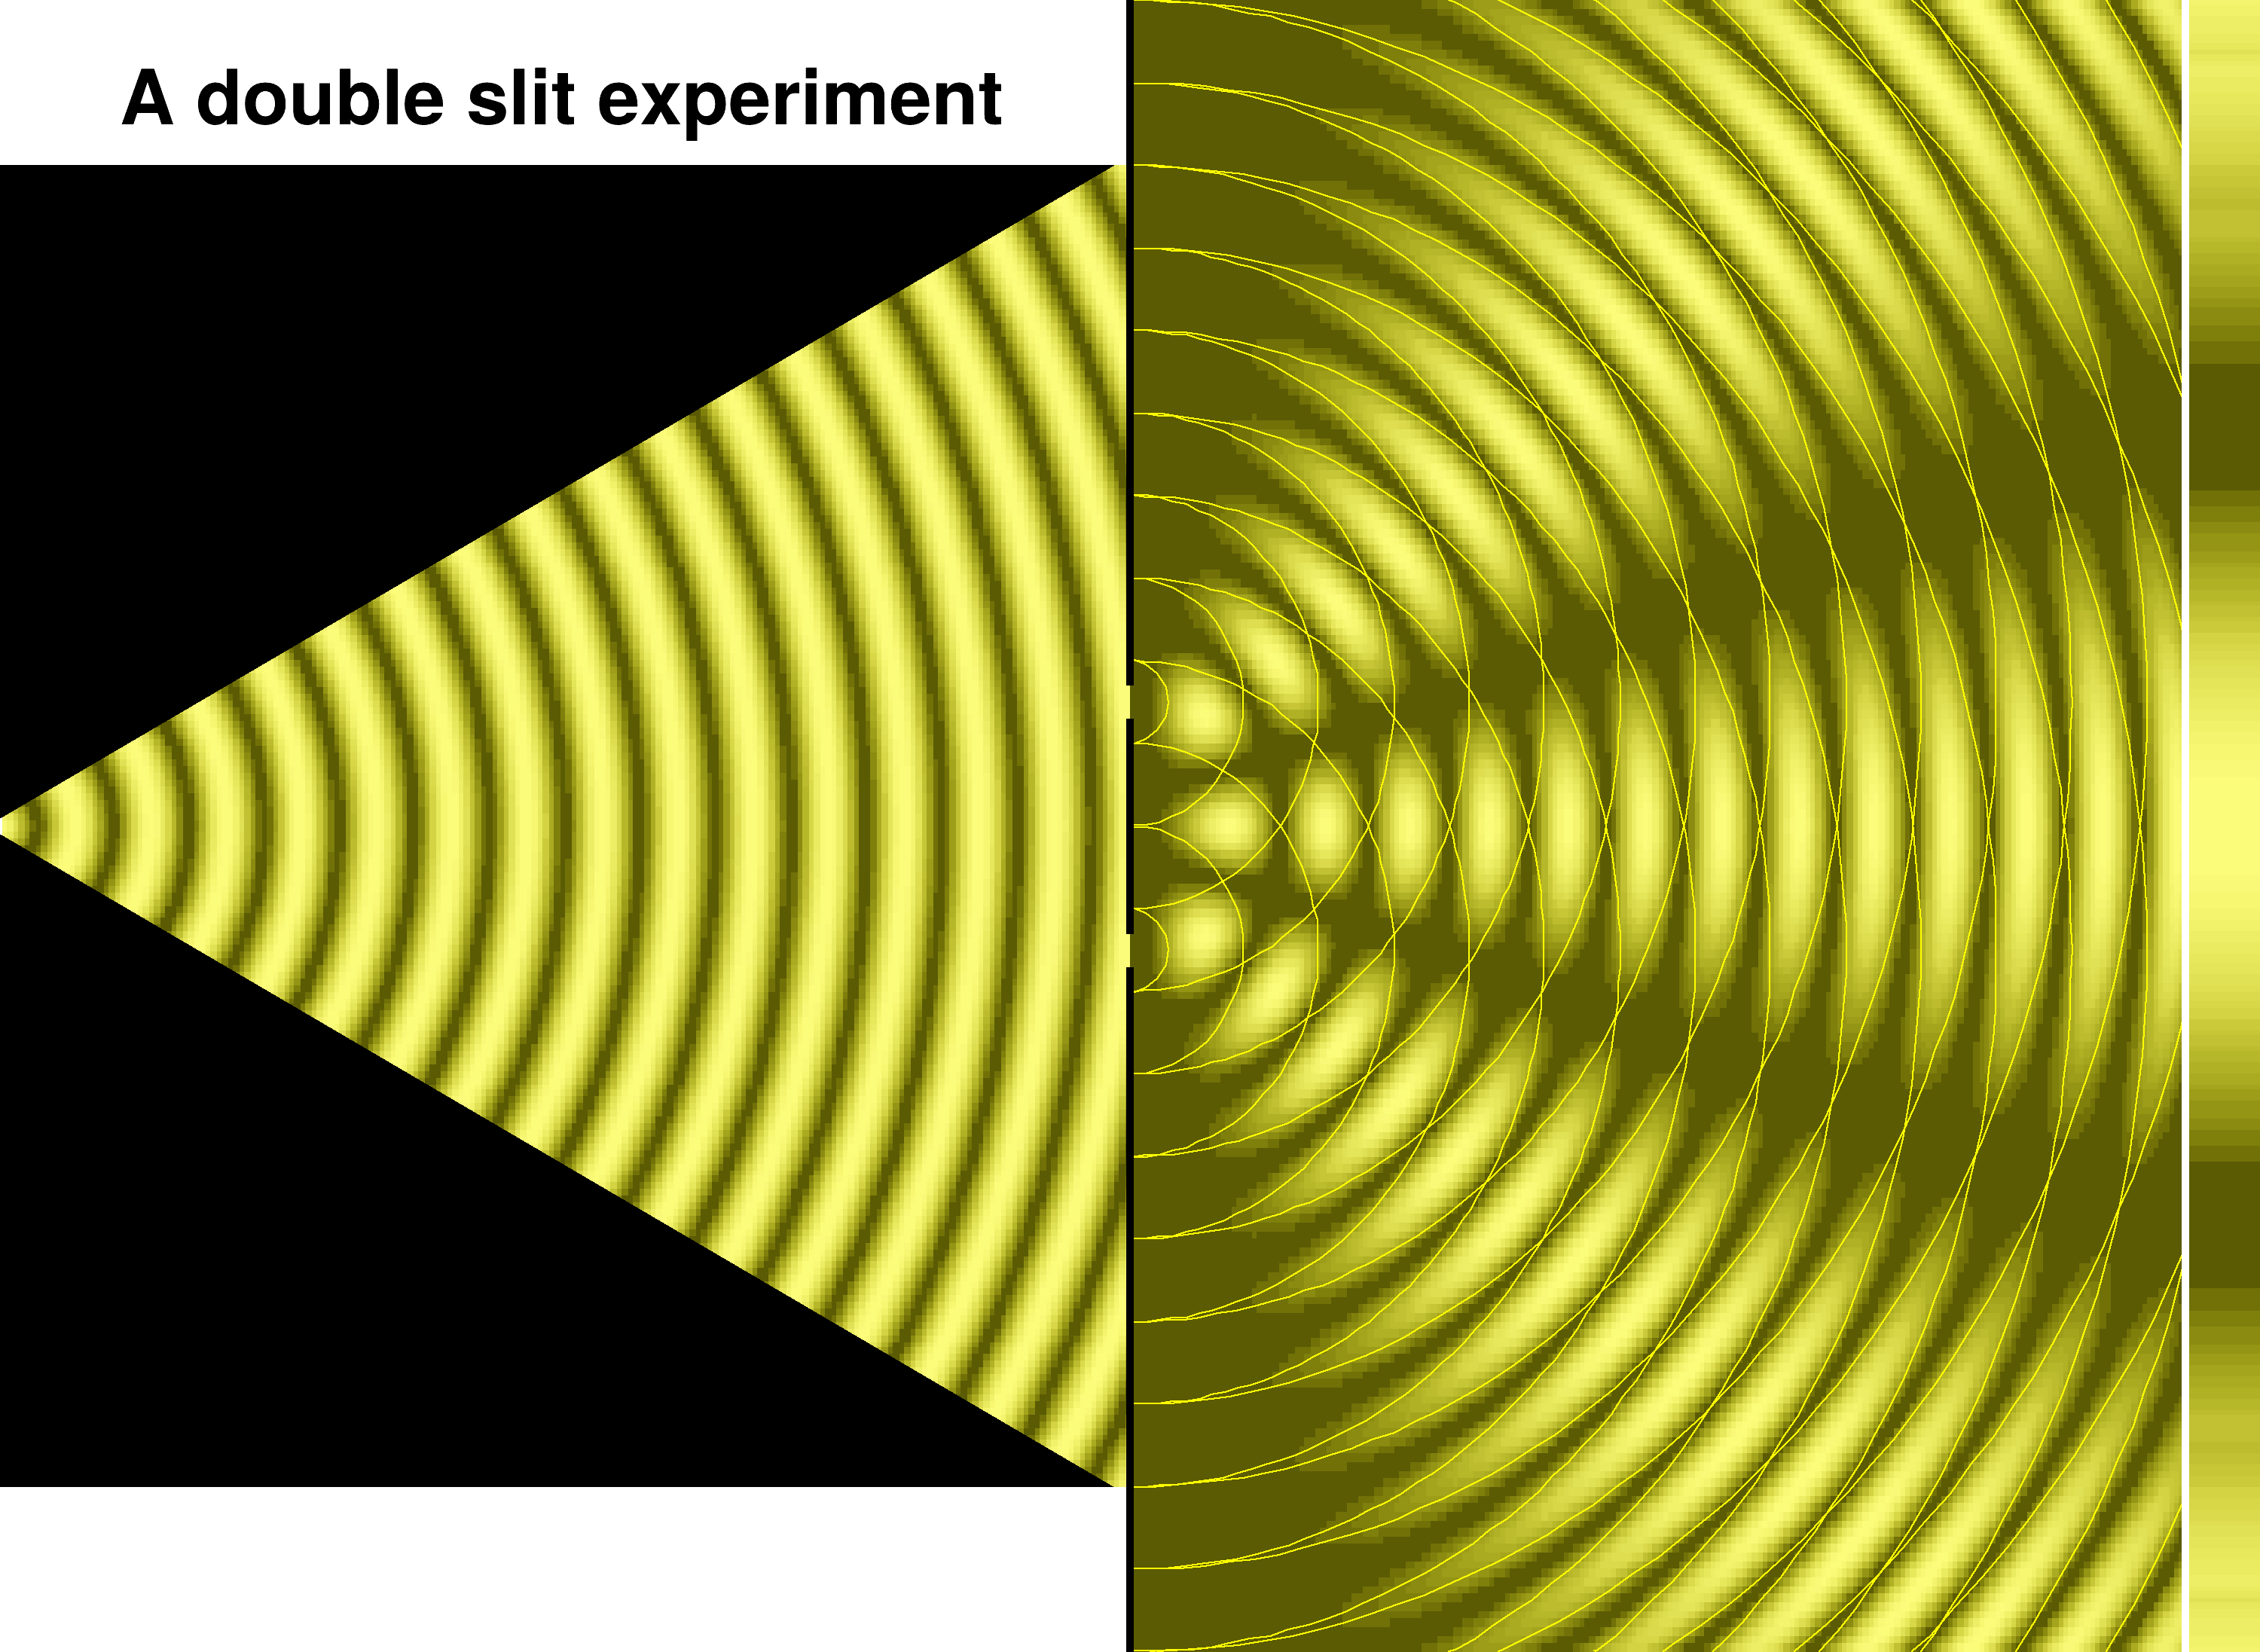 Draw spherical waves interference. Draw spherical waves interference. | |
| gr202_textmarkers.C | |
 Draw a graph with text attached to each point. Draw a graph with text attached to each point. | |
| gr301_highlight1.C | |
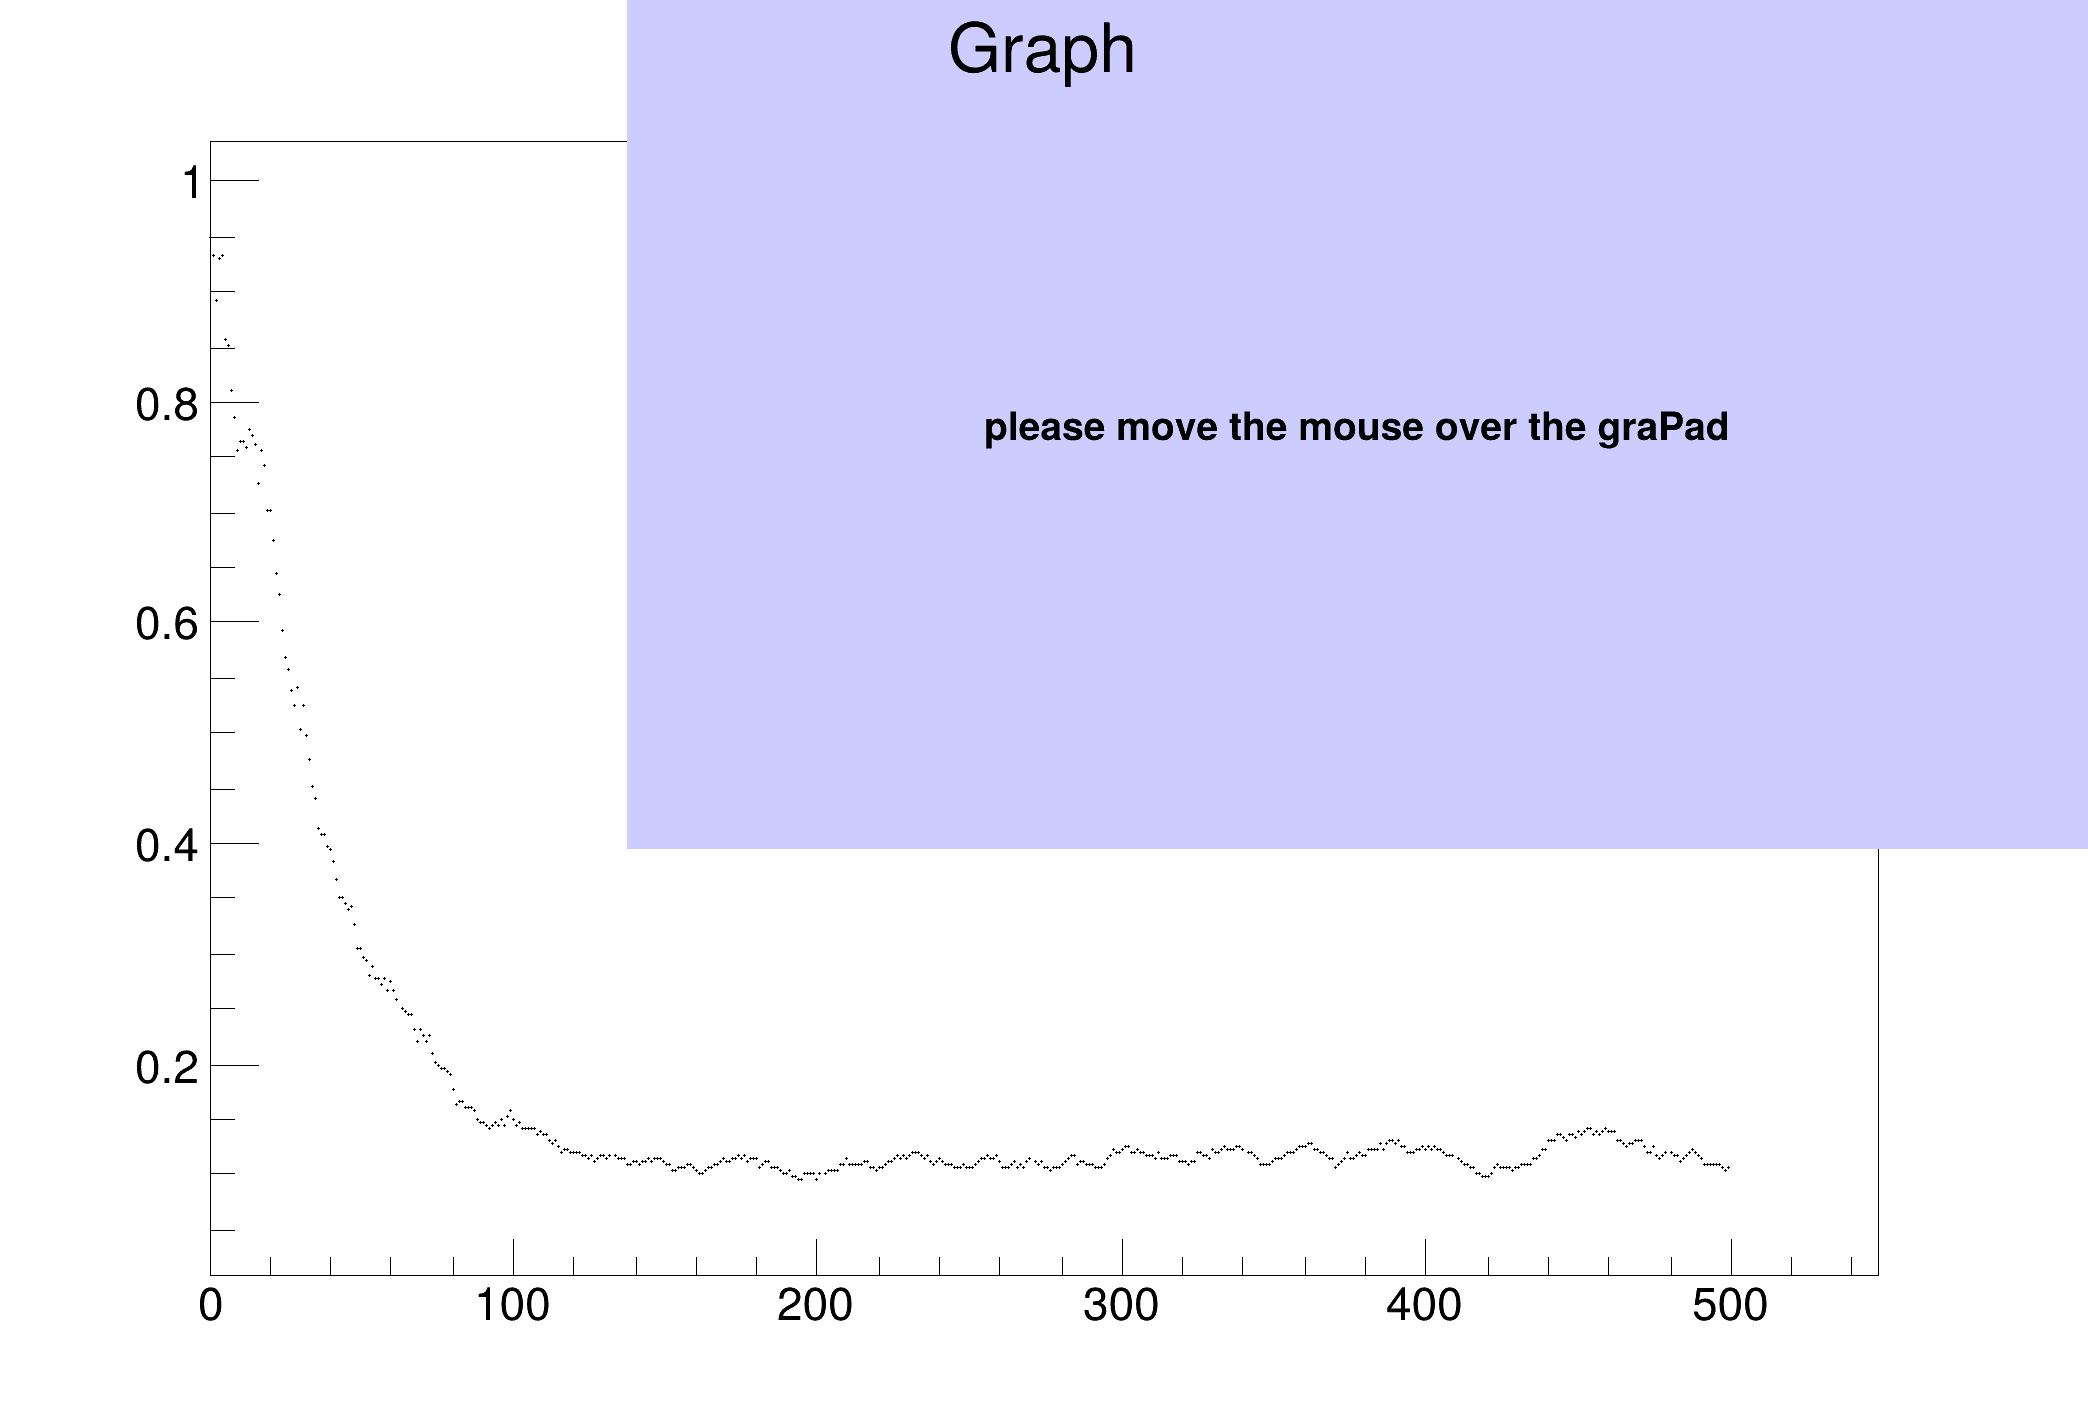 This tutorial demonstrates how to use the highlight mode on graph, thanks to the TCanvas HighlightConnect method. This tutorial demonstrates how to use the highlight mode on graph, thanks to the TCanvas HighlightConnect method. | |
| gr302_highlight2.C | |
 This tutorial demonstrates how to use the highlight mode on graph, thanks to the TCanvas HighlightConnect method. This tutorial demonstrates how to use the highlight mode on graph, thanks to the TCanvas HighlightConnect method. | |
| gr303_zdemo.C | |
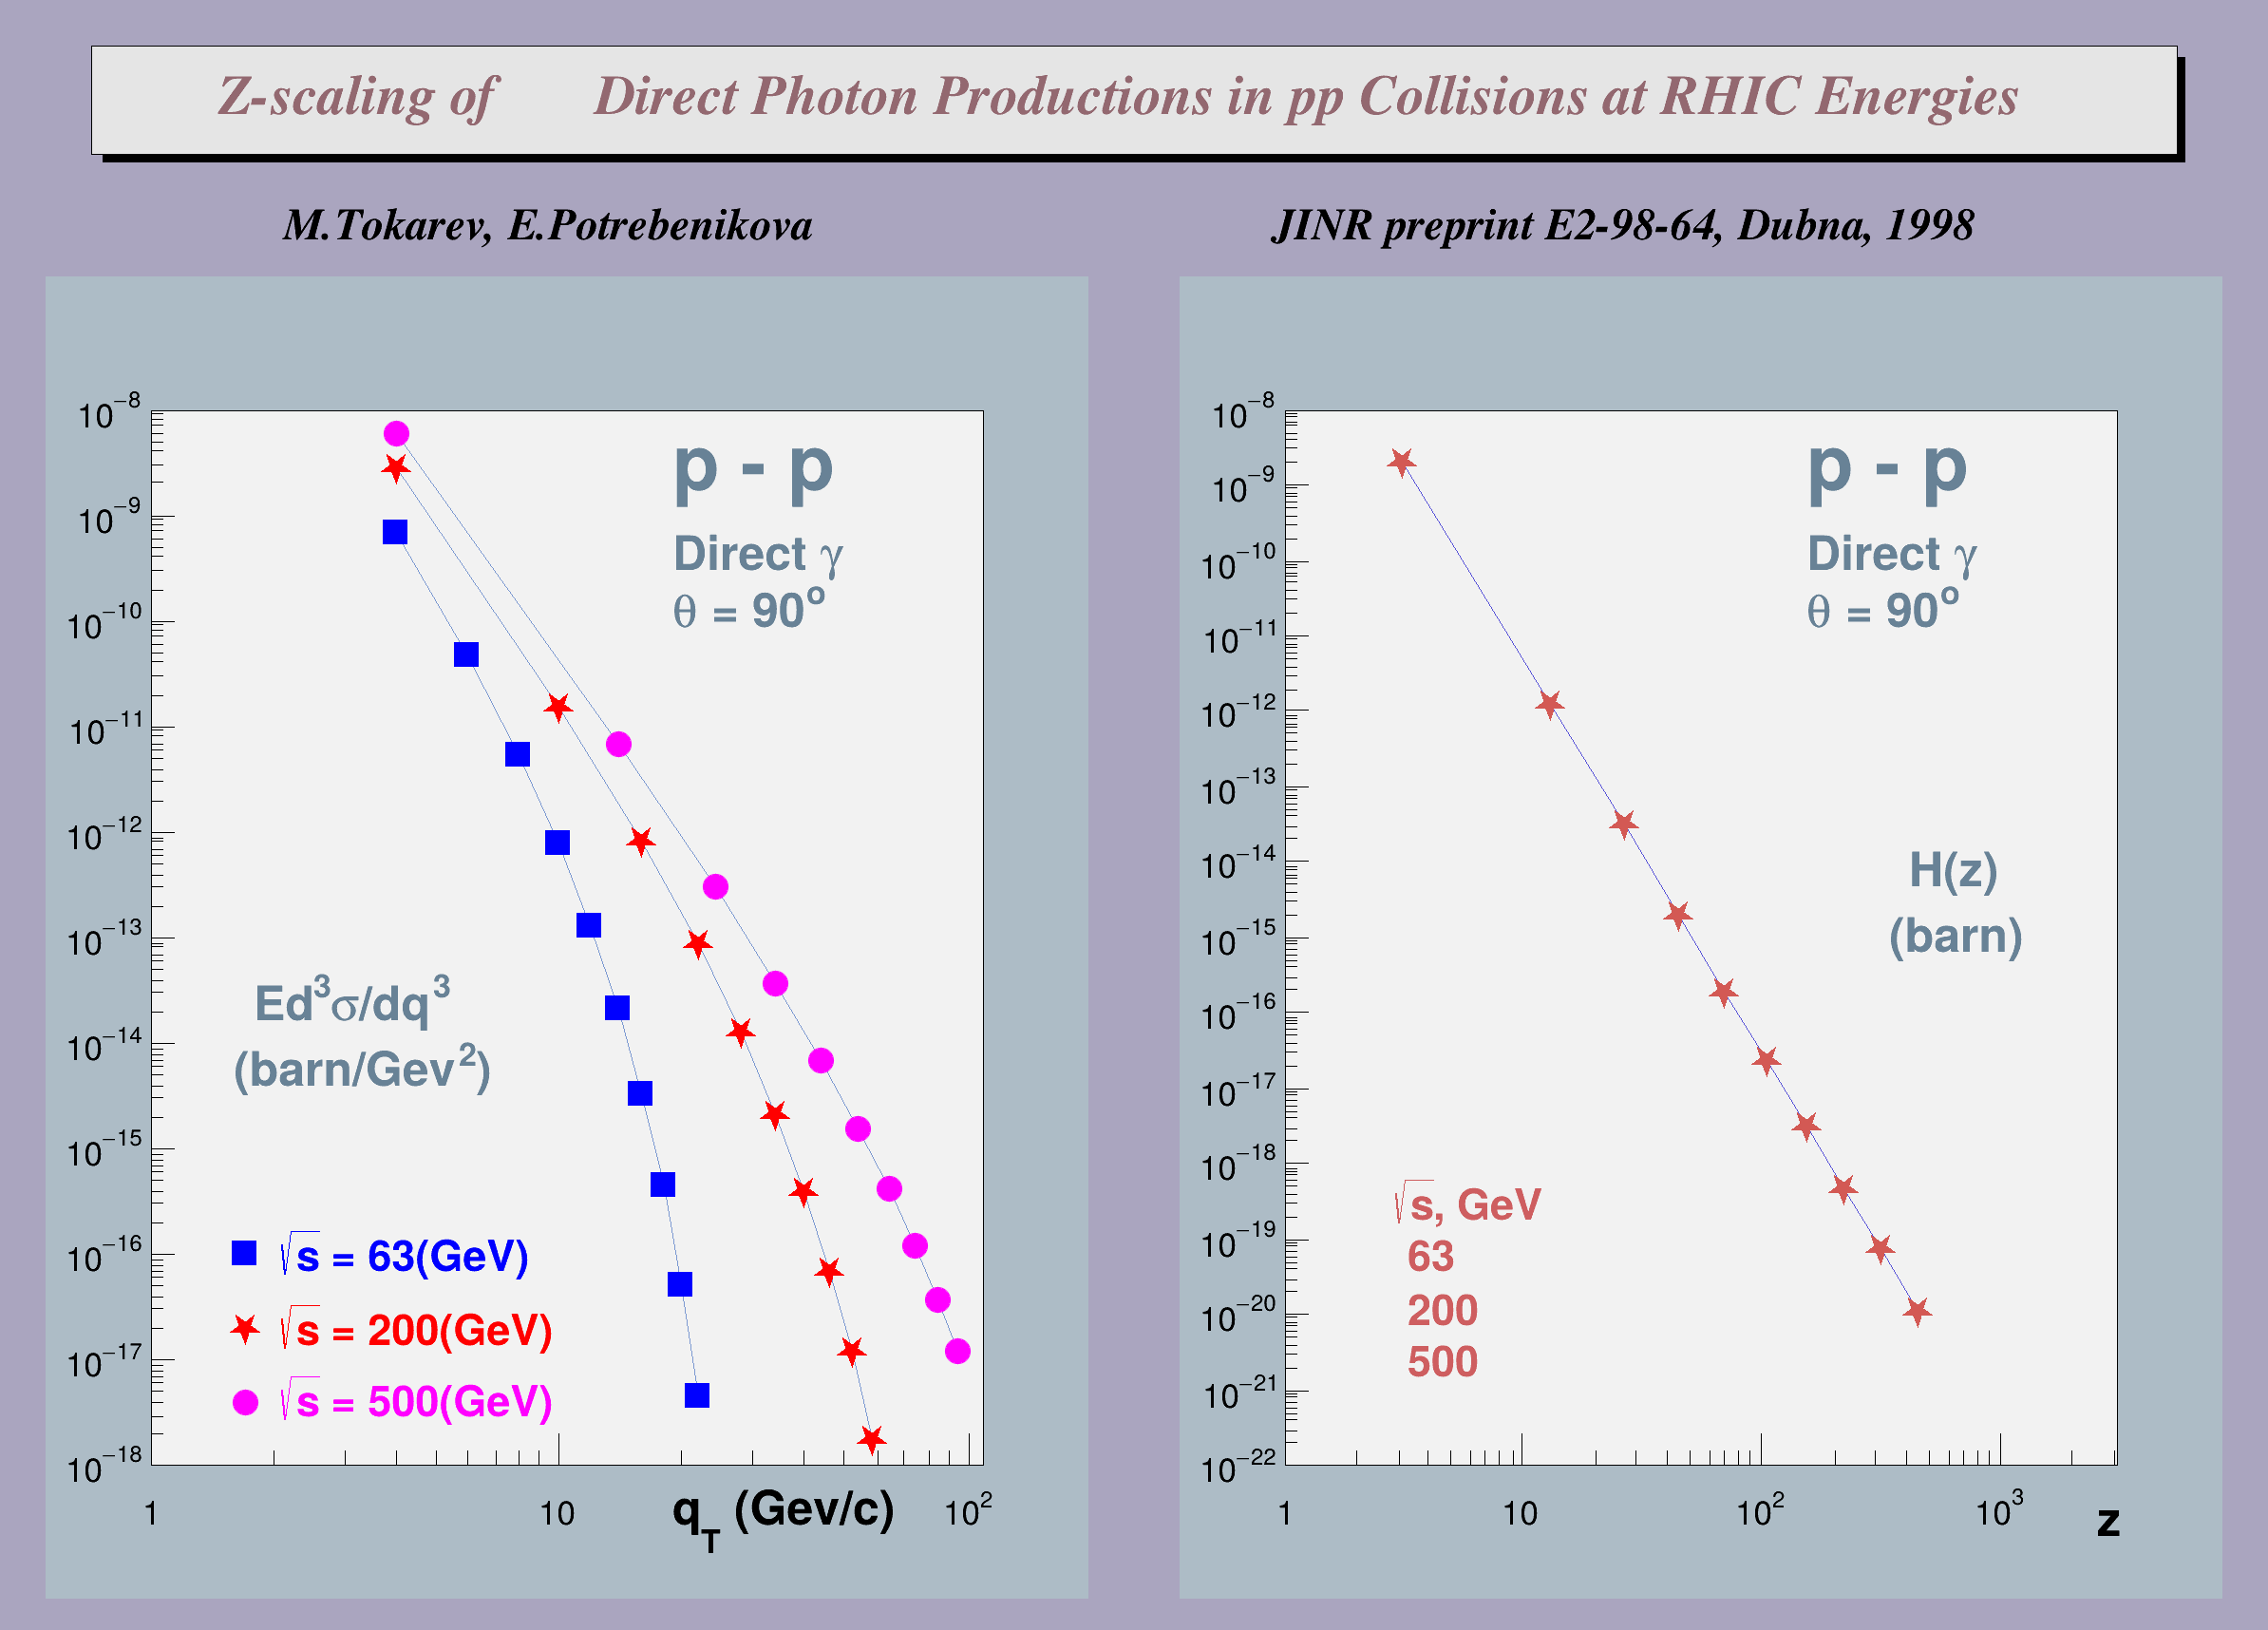 This macro is an example of graphs in log scales with annotations. This macro is an example of graphs in log scales with annotations. | |
