 |
ROOT
Reference Guide |

|
| |
ROOT
Reference Guide |
|

![]()
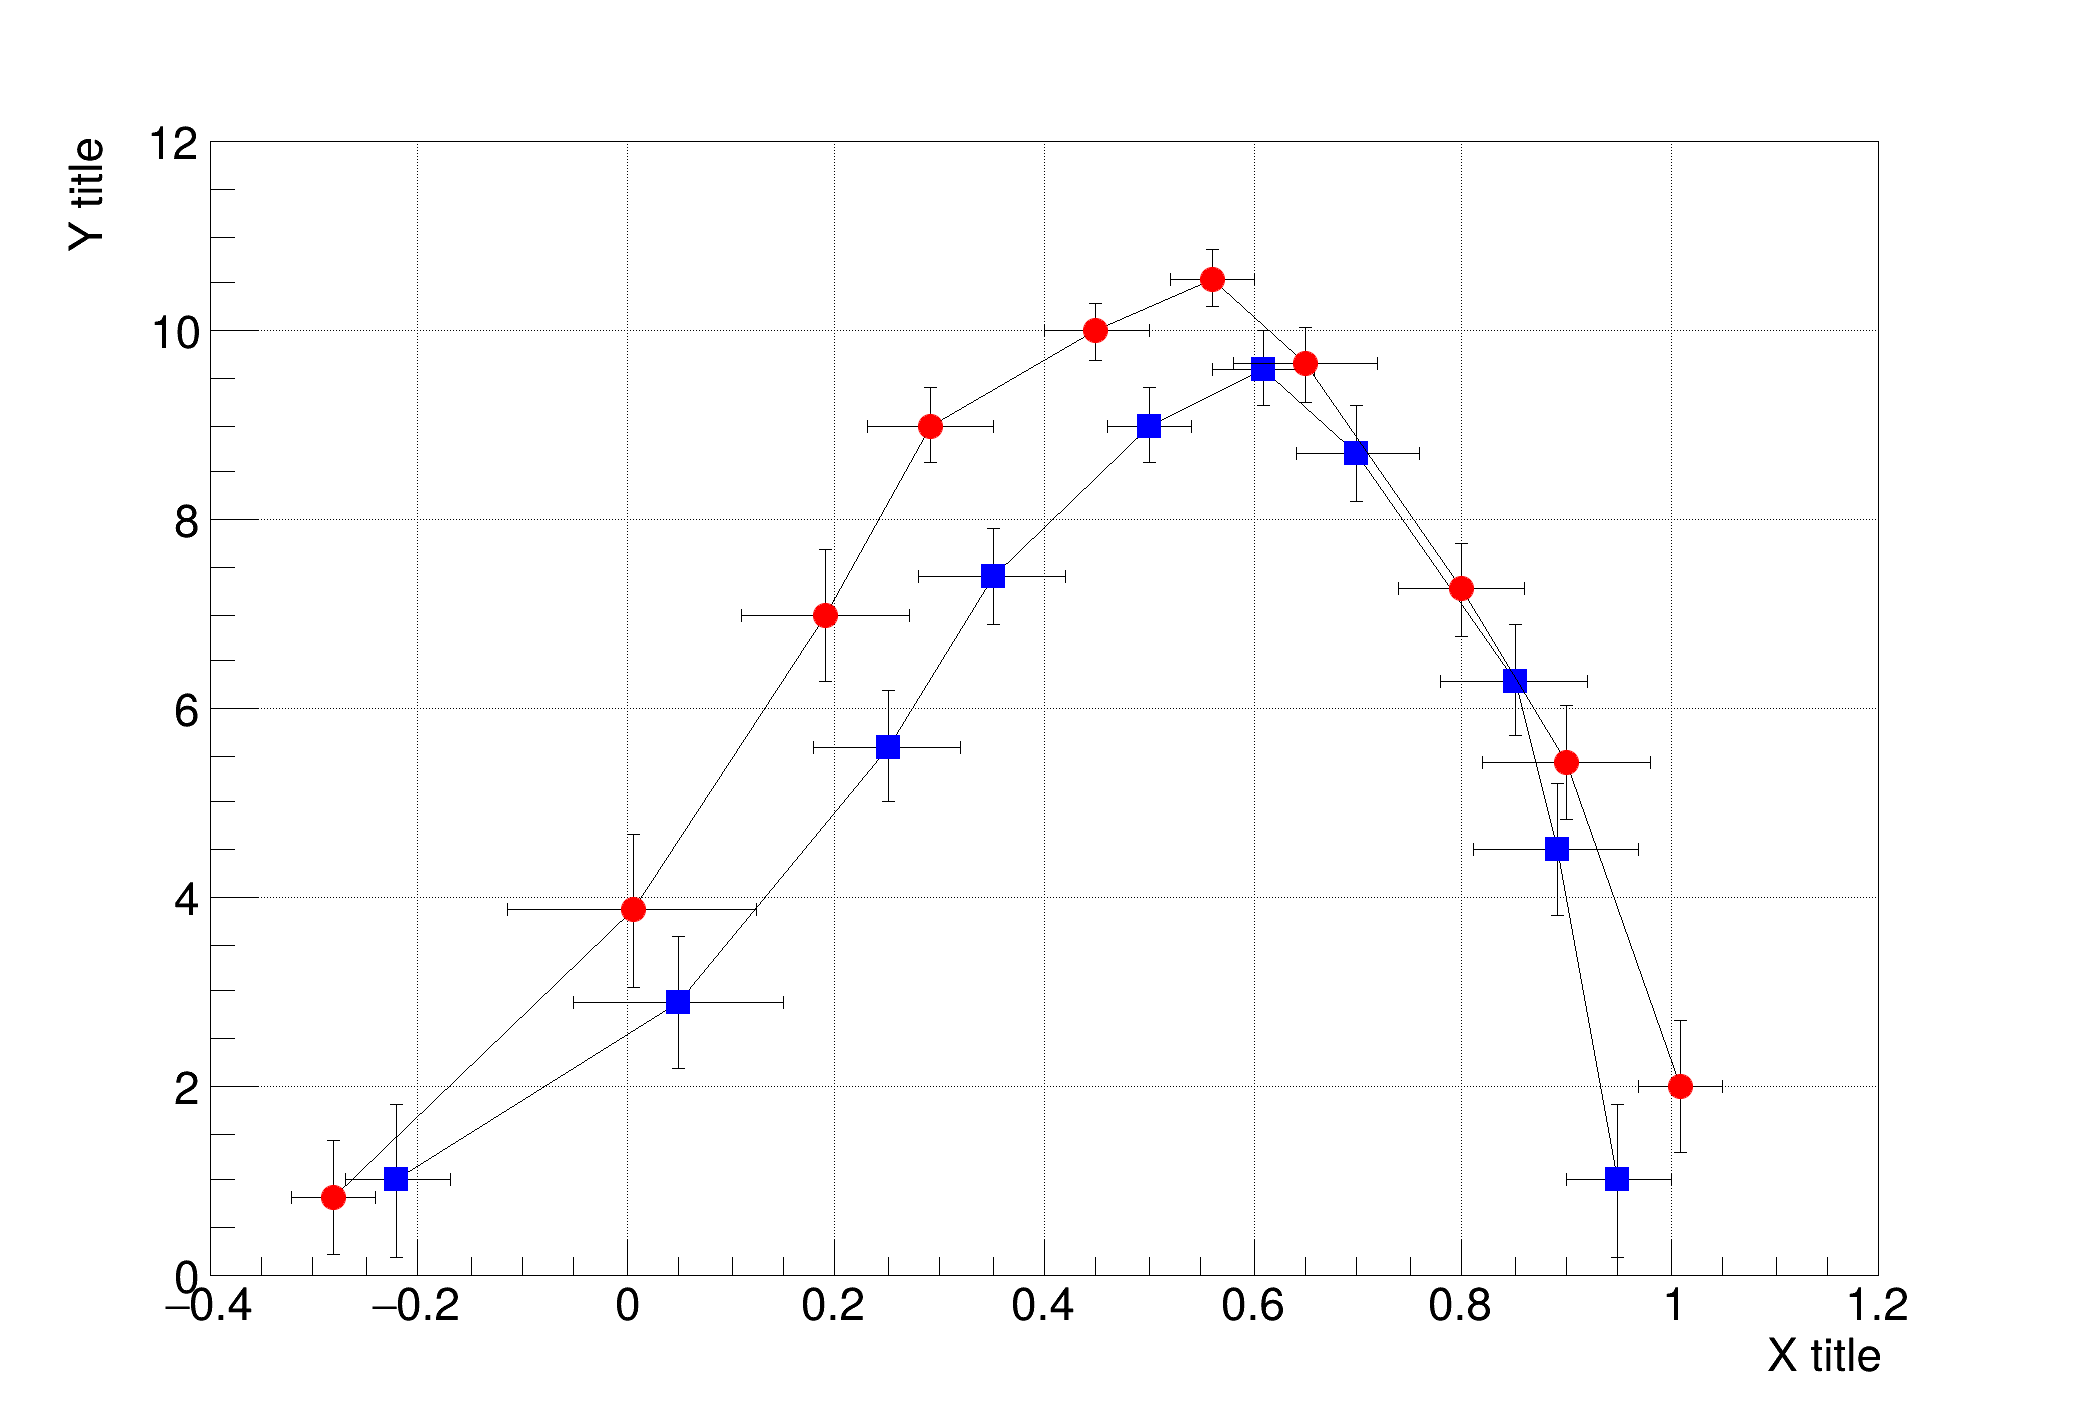 Create and draw two graphs with error bars, superposed on the same canvas
We first draw an empty frame with the axes, then draw the graphs on top of it Note that the graphs should have the same or very close ranges (in both axis), otherwise they may not be visible in the frame.
Alternatively, an automatic axis scaling can be achieved via a TMultiGraph
See the TGraphErrors documentation
Definition in file gr003_errors2.py.
