Logo ROOT  
Reference Guide
 
Loading...
Searching...
No Matches
gr004_errors_asym.py File Reference

Detailed Description

View in nbviewer Open in SWAN
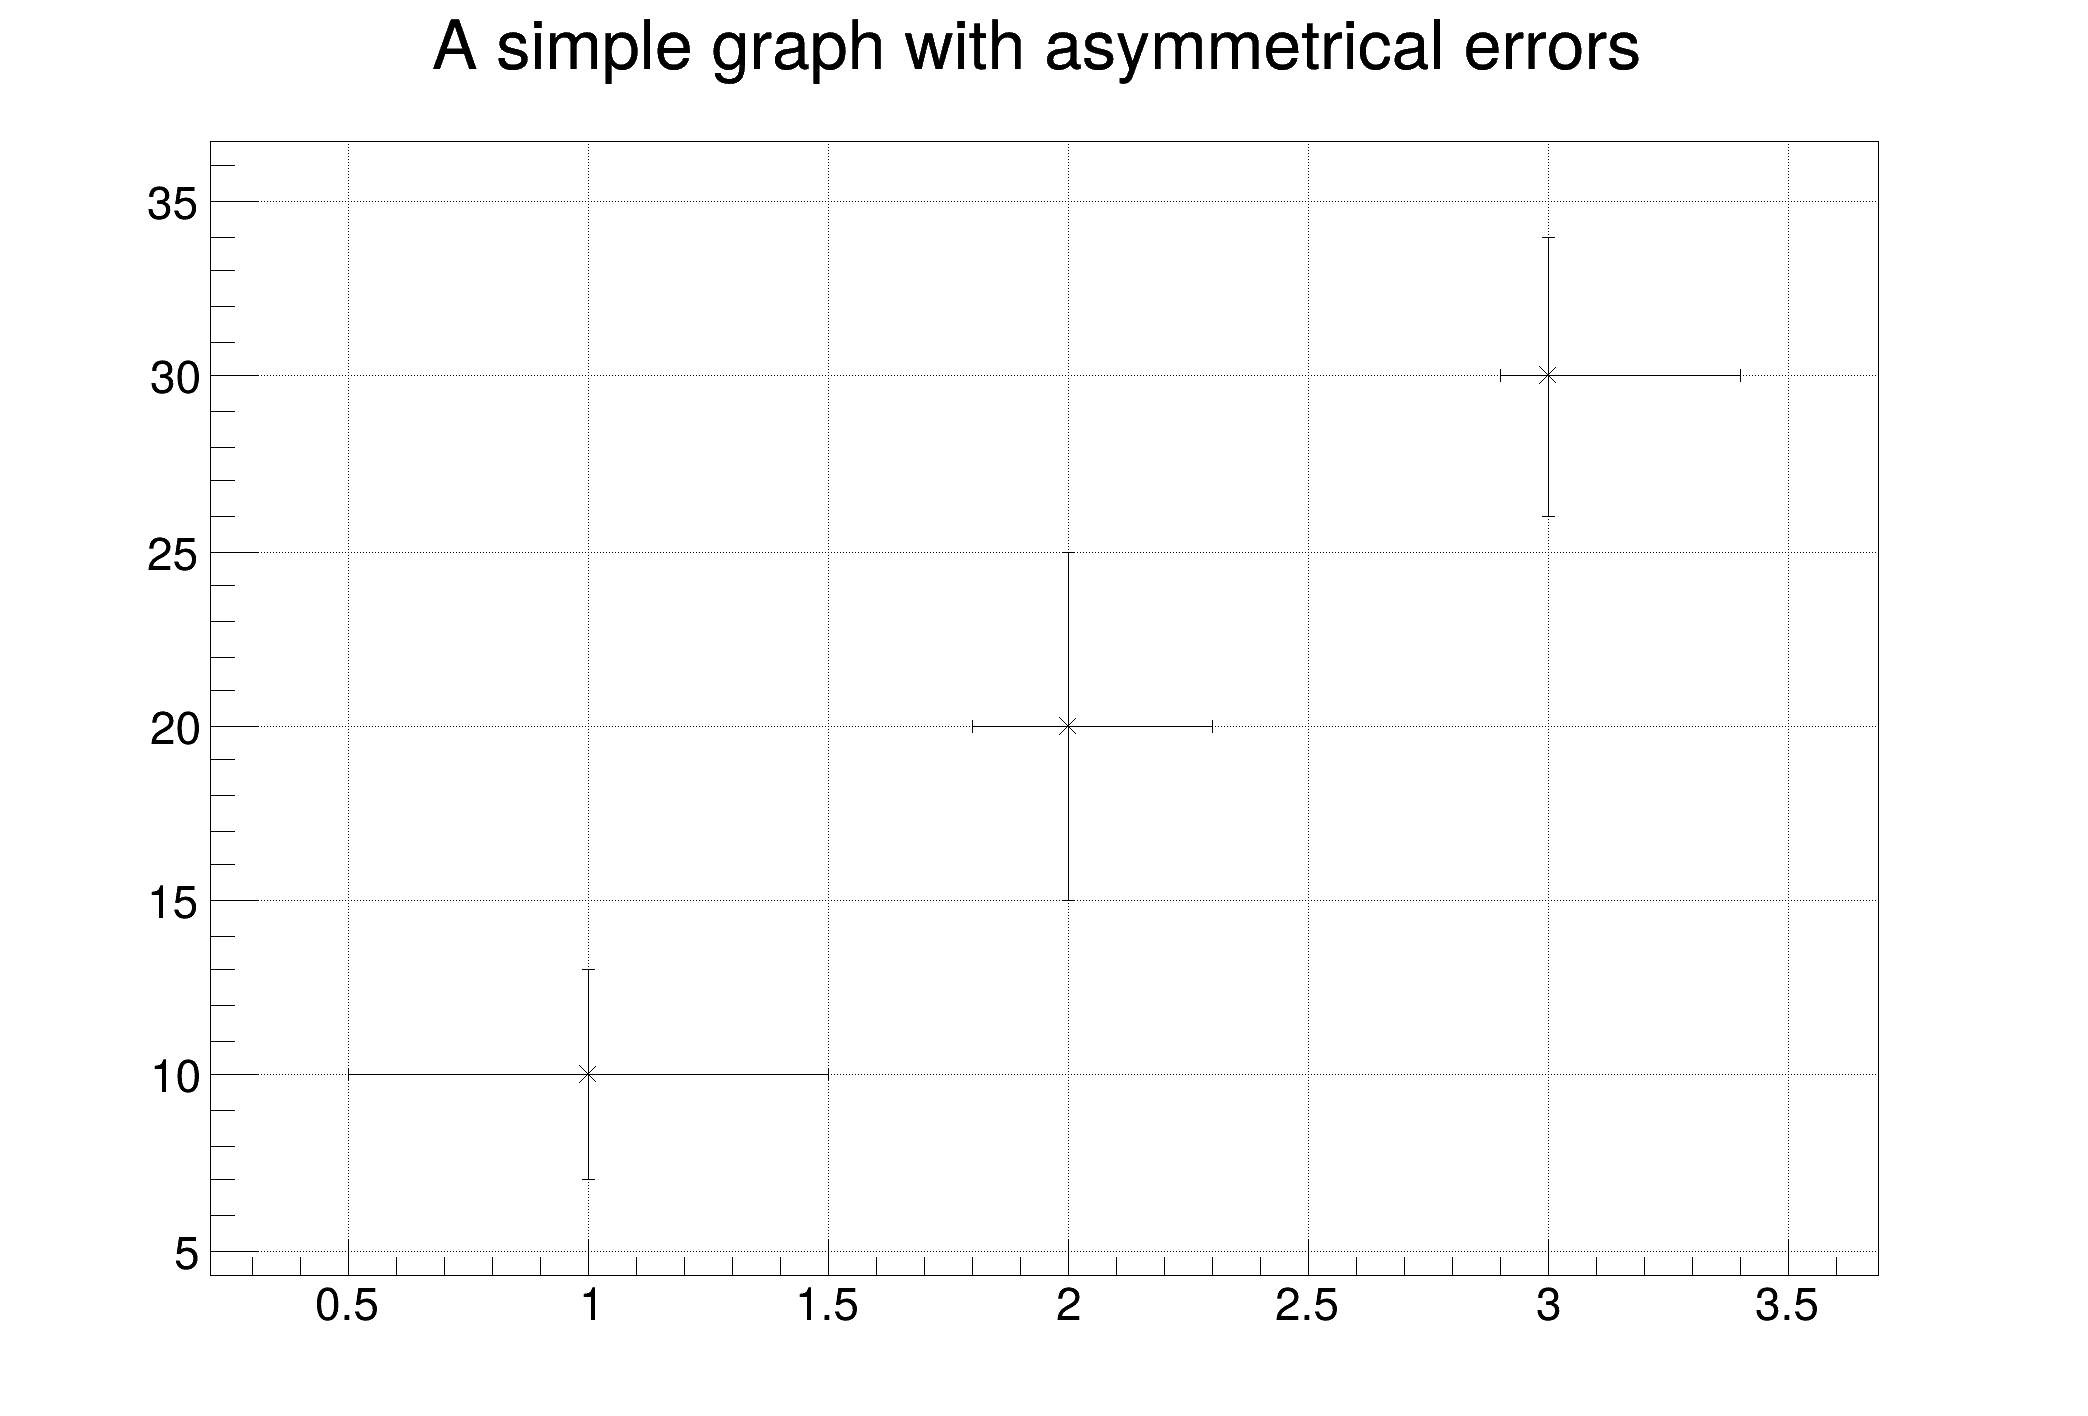
This tutorial demonstrates the use of TGraphAsymmErrors to plot a graph with asymmetrical errors on both the x and y axes.

The errors for the x values are divided into low (left side of the marker) and high (right side of the marker) errors. Similarly, for the y values, there are low (lower side of the marker) and high (upper side of the marker) errors.

import numpy as np
import ROOT
c2 = ROOT.TCanvas("c2", "", 700, 500)
npoints = 3
xaxis = np.array([1.0, 2.0, 3.0])
yaxis = np.array([10.0, 20.0, 30.0])
exl = np.array([0.5, 0.2, 0.1]) # Lower x errors
exh = np.array([0.5, 0.3, 0.4]) # Higher x errors
eyl = np.array([3.0, 5.0, 4.0]) # Lower y errors
eyh = np.array([3.0, 5.0, 4.0]) # Higher y errors
npoints, xaxis, yaxis, exl, exh, eyl, eyh
) # Create the TGraphAsymmErrors object with data and asymmetrical errors
gr.SetTitle("A simple graph with asymmetrical errors")
gr.Draw("A*") # "A" = draw axes and "*" = draw markers at the points with error bars
ROOT::Detail::TRangeCast< T, true > TRangeDynCast
TRangeDynCast is an adapter class that allows the typed iteration through a TCollection.
Author
Miro Helbich, Jamie Gooding

Definition in file gr004_errors_asym.py.