Allowing to overlay different graphs can be useful for comparing different datasets or for plotting multiple related graphs on the same canvas.
void gr007_multigraph() {
auto c1 =
new TCanvas(
"c1",
"multigraph",700,500);
Double_t px1[] = {-0.1, 0.05, 0.25, 0.35, 0.5, 0.61,0.7,0.85,0.89,0.95};
Double_t py1[] = {-1,2.9,5.6,7.4,9,9.6,8.7,6.3,4.5,1};
Double_t ex1[] = {.05,.1,.07,.07,.04,.05,.06,.07,.08,.05};
auto func1 = (
TF1 *)
gr1->GetListOfFunctions()->FindObject(
"gaus");
Float_t x2[] = {-0.28, 0.005, 0.19, 0.29, 0.45, 0.56,0.65,0.80,0.90,1.01};
Float_t y2[] = {2.1,3.86,7,9,10,10.55,9.64,7.26,5.42,2};
Float_t ex2[] = {.04,.12,.08,.06,.05,.04,.07,.06,.08,.04};
auto func2 = (
TF1 *)
gr2->GetListOfFunctions()->FindObject(
"pol5");
mg->Draw("ap");
}
}
Option_t Option_t TPoint TPoint const char x2
Option_t Option_t TPoint TPoint const char y2
R__EXTERN TStyle * gStyle
A TGraphErrors is a TGraph with error bars.
A TMultiGraph is a collection of TGraph (or derived) objects.
The histogram statistics painter class.
void SetOptFit(Int_t fit=1)
The type of information about fit parameters printed in the histogram statistics box can be selected ...


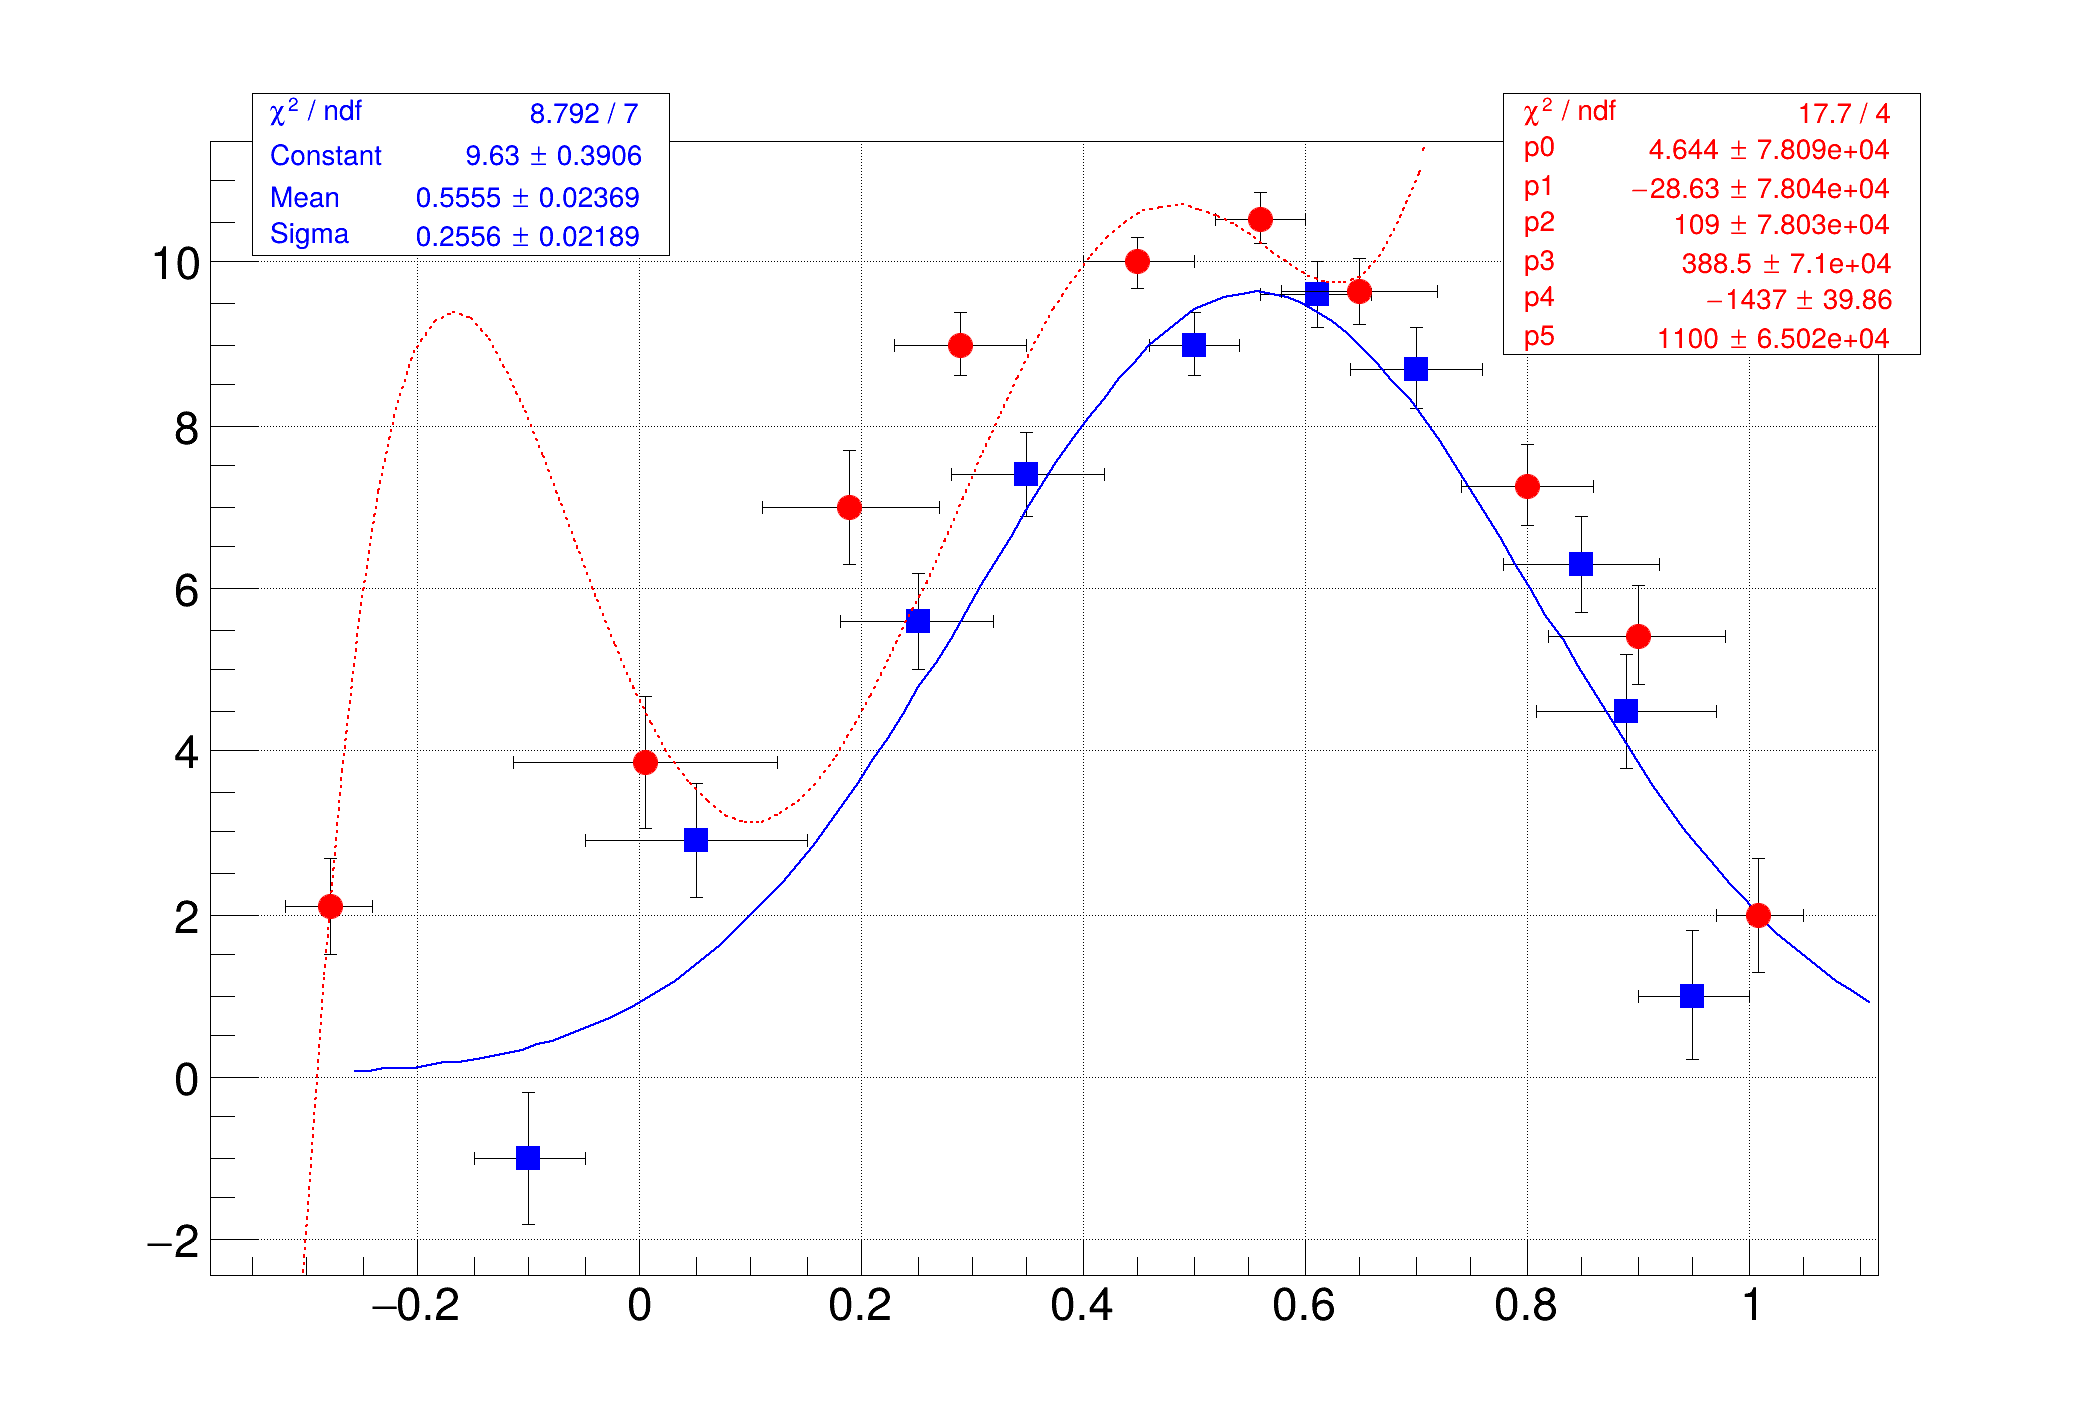 TMultiGraph is used to combine multiple graphs into one plot.